


 75 / 234

71
Chapter 5: Inland and Marine Waters
In summary, based on preliminary analysis of the most
recent datasets, there has been no improvement in river
water quality (based on Q values) or transitional and
coastal water quality over the past six years (Figure 5.6).
Lake water quality has gotten slightly worse with a 3%
reduction in the number of monitored lakes at satisfactory
status. While a full WFD assessment will not be available
until later in 2016 it is clear that insufficient progress is
being made with improving Ireland’s surface water quality.
Preliminary results for 2013‑2015 and other key findings in
the EPA water quality report (2010‑2012) were:
n
There has been a gradual decline in high-status river
sites across Ireland. Numbers halved in the 22-year
period between 1987 and 2015 (Figure 5.5) with the
most dramatic losses occurring in the highest quality
sites (Q5 sites). These sites represent the best-quality
rivers across Ireland, and therefore their continuing loss
is a very significant concern.
3 For this figure river water quality is solely based on Q values. Lake data
only covers monitored lakes.
n
Seriously pollution of rivers has fallen to just over 6 km
compared to 17 km in 2010-2012 and 53 km 2007‑2009.
n
Reported fish kills have declined to an all-time low of
70 between 2010 and 2012 (EPA, 2015b).
n
Water quality in canals remains very high, with over
90% of canals rated satisfactory in 2012.
n
The south and south-east of the country continue to
have the largest proportion of groundwater and rivers
with elevated nitrate concentrations over 10 mg/l NO
3
.
This contributes to eutrophication in certain
downstream estuaries.
n
In 2012, 18% of monitored rivers and 27% of
monitored lakes were less than good status due to fish
status. Preliminary assessment suggests that barriers
to fish migration and physical deterioration of habitats
may be partly to blame.
n
In 35% of designated shellfish waters with elevated
faecal contamination, additional measures to improve
quality and achieve higher objectives are required.
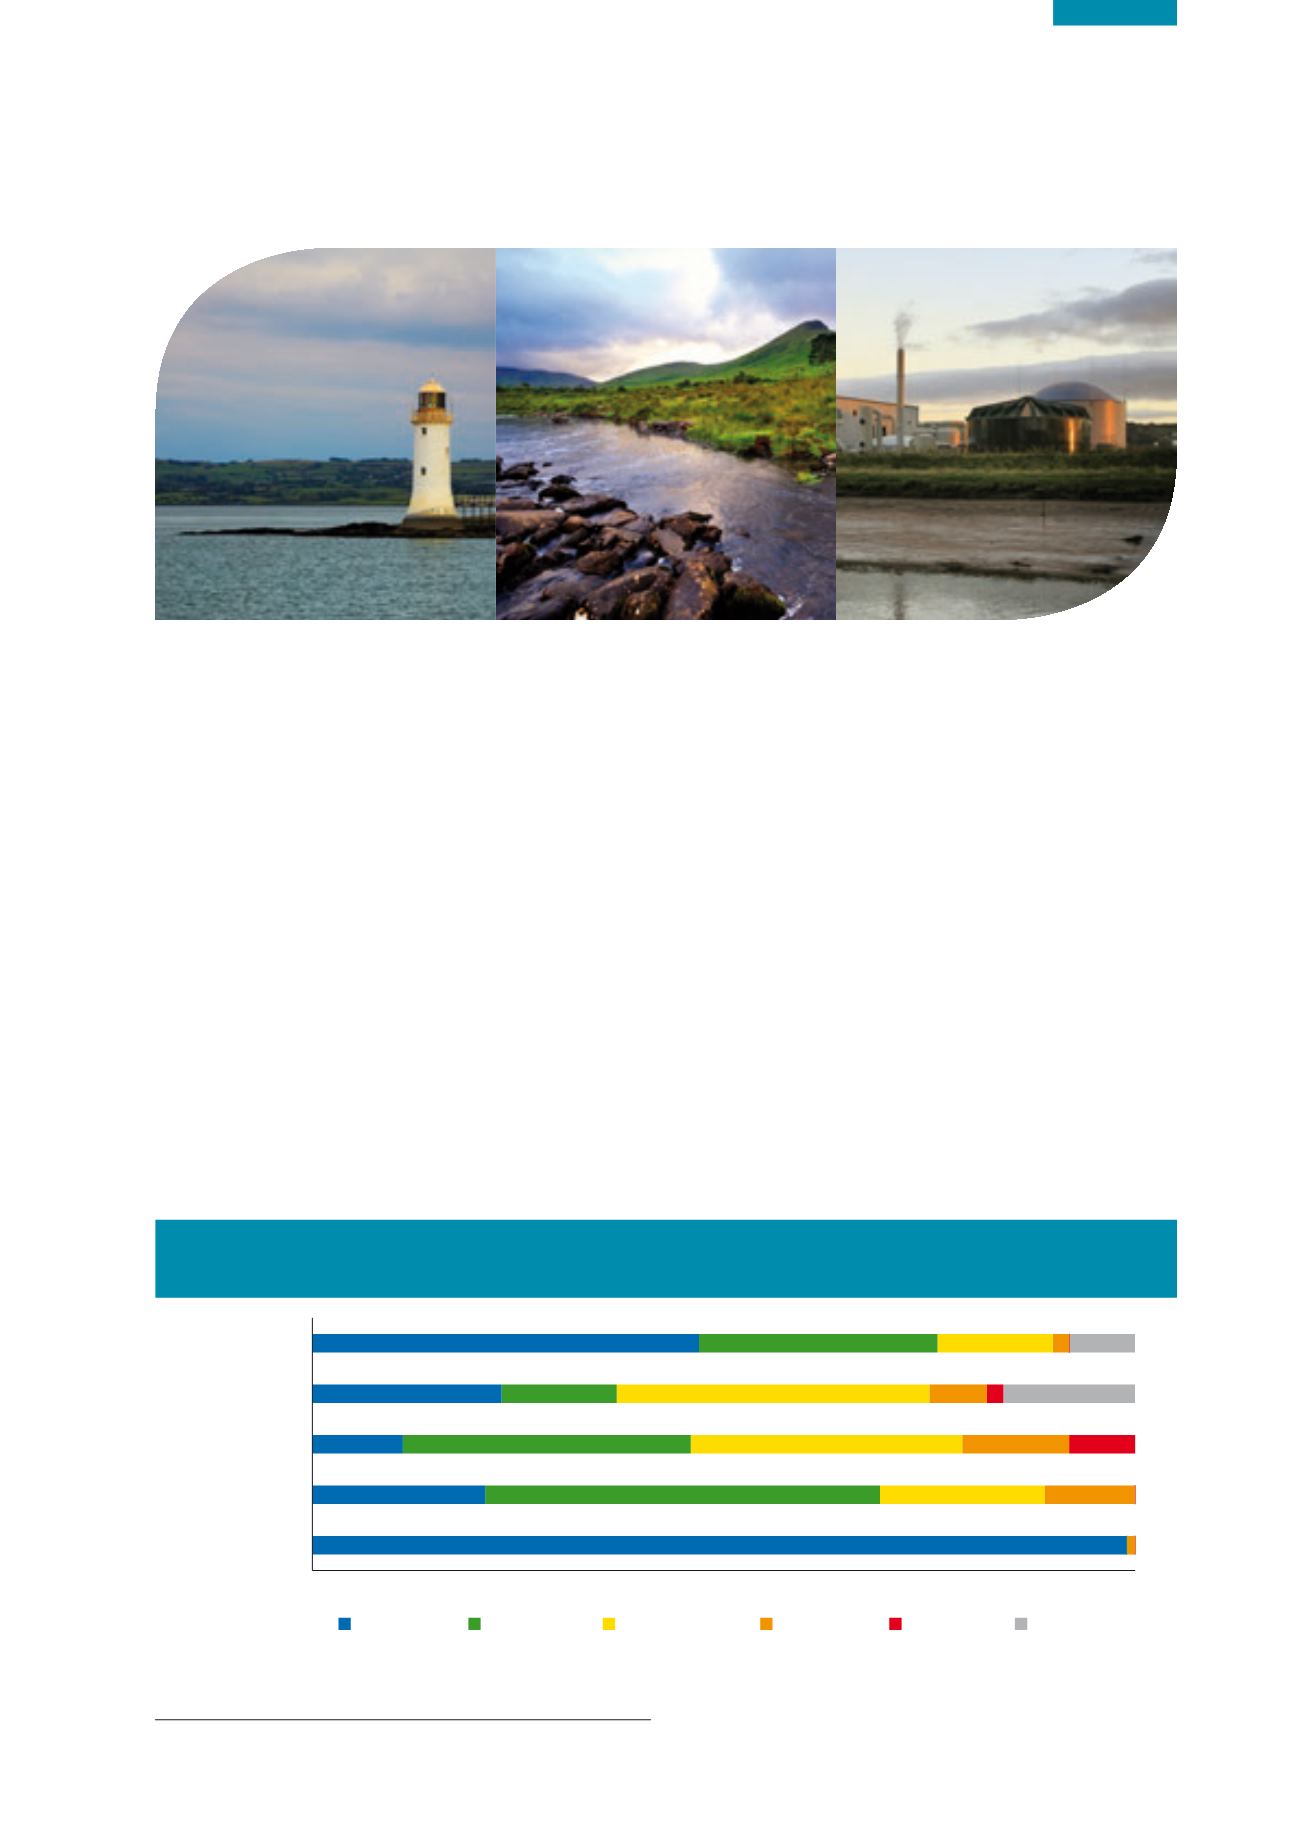
Figure 5.6
Water Assessment for Rivers, Lakes, Estuaries Coastal Waters (2013‑2015) and Groundwater (2010-2012)
3
(Source: EPA, 2016a)
0%
20%
40%
60%
80%
100%
Unassigned
Bad
Poor
Moderate
Good
High
Groundwater (area)
River Channel Length
Lake Waterbodies
Estuarine Waterbodies
Coastal Waterbodies
99%
21%
48%
20%
11%
11%
35%
33%
13%
8%
23%
14%
38%
7%
16%
2%
47%
29%
14%
2% 8%
1%