


 73 / 234

69
Chapter 5: Inland and Marine Waters
Current Situation
Overall assessments show significant challenges ahead
in bringing all waters up to a satisfactory level and to
protect waters already in good condition.
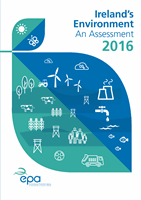
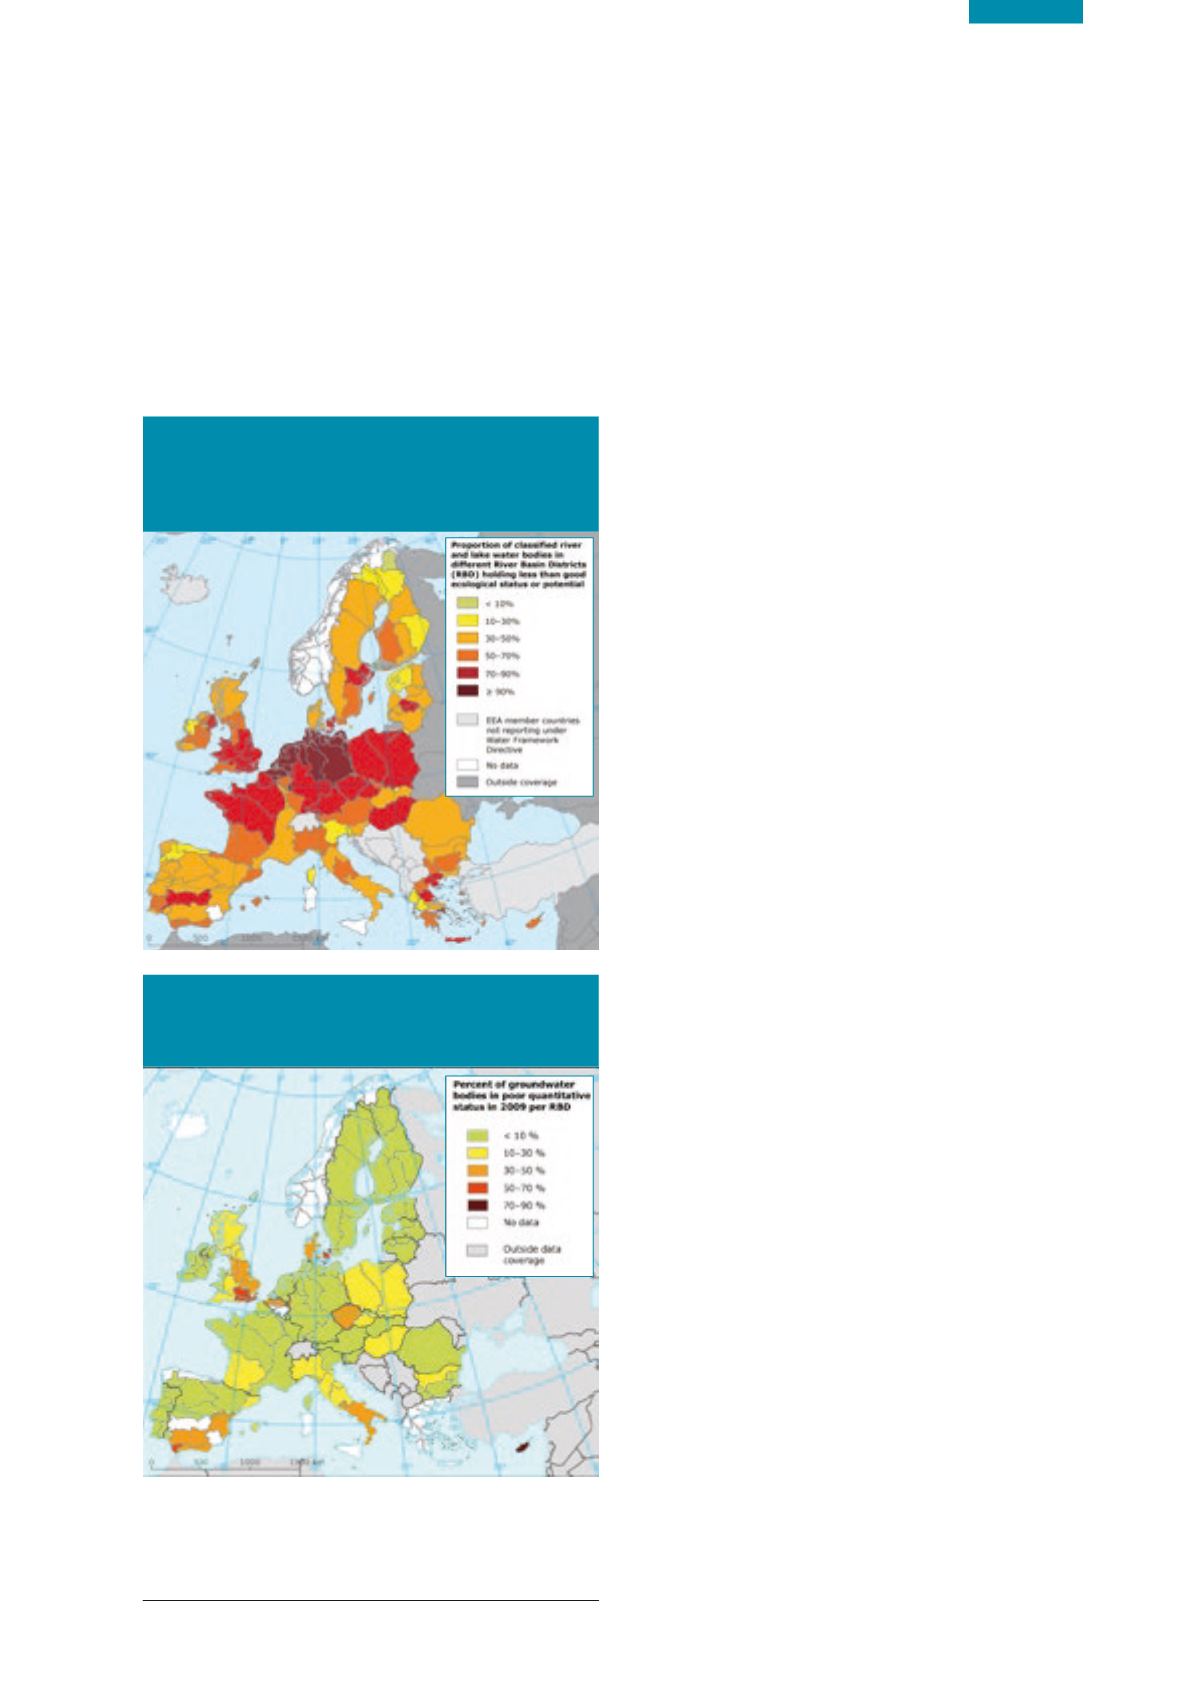
The quality of Irish groundwater and surface waters is
among the best in Europe
2
(Figures 5.2 and 5.3).
Figure 5.2
Proportion of Classified Surface Water
Bodies (Rivers and Lakes) in Different River Basin
Districts Holding Less Than Good Ecological Status or
Potential (Source: EEA, 2015)
Figure 5.3
Percentage of Groundwater Bodies in Poor
Quantitative Status in 2009 per River Basin District
(Source:EEA, 2015)
2
www.eea.europa.eu/themes/waterHowever, there are many impacts that need to be addressed
to bring all waters up to a satisfactory level and to protect
waters already in good condition. Ireland is fortunate to have
such good-quality waters in comparison with many of our
European neighbours, and our future wealth and prosperity
is very dependent on us maintaining and strengthening this
position. With regard to biodiversity, species considered to
be most under threat are those linked to wetlands and those
that are sensitive to water pollution (see Chapter 4).
Preliminary results indicate that there has been no
overall improvement in water quality over the first
river basin planning cycle.
Rivers
Substantial loss in the number of highest quality
river sites.
Under the Water Framework Directive a substantial
number of chemical and biological elements are assessed
to determine the overall status of waters. One of the
key elements for rivers is the macroinvertebrate fauna
found within the waters and this is monitored and
assessed in Ireland using the EPA Q value method. The
macroinvertebrate Q value method has been employed
in the assessment of Irish rivers over a long period and it
enables trends in the quality of river waters to be viewed
over the last two decades. In the Water Quality in Ireland
Report covering the period between 2010 and 2012 (EPA,
2015b) a welcome improvement was found in the length
of unpolluted channel increasing by 4%. Unfortunately this
improvement has not been maintained and the length of
unpolluted channel has reverted to the levels found between
2007 and 2009. Despite minor variations in each monitoring
period overall levels of pollution remain relatively constant
since the beginning of the 1990s (see graph below). Some
improvements have been made with the length of seriously
polluted channel being reduced to just over 6 km in the
2013 to 2015 period compared with 17 km between 2010
and 2012 and 53 km between 2007 and 2009.
While overall the length of unpolluted river channel has
remained relatively constant there has been a substantial
loss in the number of sites where the highest quality
river sites are found (i.e. Q value of 5). In the most
recent monitoring period (2013-2015) only 21 sites were
classified as the highest quality rivers (0.7% of sites)
compared with 575 between 1987 and 1990 and 82
between 2001 and 2003. This is an area where substantial
effort is required to protect the few remaining highest
quality rivers and, where feasible, return impacted ones
back to their earlier extremely high quality.
Further assessment is required to determine the overall
status of river waters to take account of all other elements
including other biological, chemical ones. This full
assessment will be provided in the next water quality in
Ireland report (covering 2013 to 2015).