


 79 / 234

75
Chapter 5: Inland and Marine Waters
and some deep-water sharks. Although there are zero Total
Allowable Catches or prohibited listings for these species,
several of them remain vulnerable to existing fisheries.”
Sea Fishing By-catch
New controls are in place to try to end the practice of
discarding fish back into the sea.
The landing obligation was introduced under the
Common Fisheries Policy (CFP) to try to end the practice of
discarding fish back into the sea if they are too small or are
not the targeted species or if the fisherman had no quota
for them. This was put in place for pelagic species in 2015
and, since January 2016, this obligation is being phased
in for certain demersal fisheries, including Norway lobster
(Nephrops), hake, cod, haddock, whiting and saithe,
common sole and plaice, each subject to catch limits.
Once a stock falls under the landing obligation, all catches
must be landed and counted against quota. Catches of
fish below minimum size cannot be sold for direct human
consumption, but may be sold for other purposes, such
as bait or fish meal, and are still deducted from quota.
Here the intention is to discourage the catches of such
fish in the first instance through improved selectivity or
avoidance.
Impacts of Marine Aquaculture
Protecting wild fisheries and preventing pollution
of the seafloor and associated impacts on
benthic communities near fish cages are two key
environmental challenges facing the sector.
In 2014, aquaculture production of shellfish and
finfish species was 34,469 tonnes and had a value of
€116 million (Source: BIM
10
). Ongoing development and
an increase in production are key parts of the Food Harvest
10
www.bim.ie/media/bim/content/publications/BIM%20Aquaculture%20 Survey%202014.pdf2020
11
strategy, and potential increases in aquaculture
production volumes of 78% have been estimated. Inputs
to the aquatic environment associated with this industry
include feedstuffs, veterinary medicines and anti-fouling
agents. A certain portion of these may be lost to the
waters and sediments in the vicinity of the fish farms.
One of the most contentious issues in relation to the
aquaculture of salmonids is the suggested link between
the production of sea lice (
Lepeophtheirus salmonis
) on
fish farms and the decline in wild sea trout populations
in the west of Ireland. Research carried out in Ireland and
Scotland suggests that sea lice from salmon farms are a
major contributory factor in the collapse of wild sea trout
populations (McKibben and Hay, 2002; Penstan
et al
.,
2002; Gargan
et al.
, 2003).
The initiation of sea lice monitoring and the adoption
of a number of measures (e.g. annual fallowing of
sites, synchronous treatment) based on a single bay
management (SBM) approach saw an initial downwards
trend in the levels of sea lice on salmon farms between
1991 and 2001. This trend was reversed between 2002
and 2007, before levels declined sharply again between
2008 and 2013, with lice levels in 2013 being the lowest
on record (O’Donoghoe
et al
., 2015). In 2014, levels
increased substantially, but it is not possible to comment
on the significance of an increase based on the findings in
just one year.
The release of organic material in the form of fish waste
and uneaten foodstuffs from fish farms in shallow-water
environments has been shown to have an impact on
the benthos in the vicinity of cage structures. While low
levels of organic loading can encourage increased benthic
productivity, the high levels associated with fish farming
can result in reduced biodiversity and a proliferation of
bacterial growth. Increased bacterial activity can lead
11
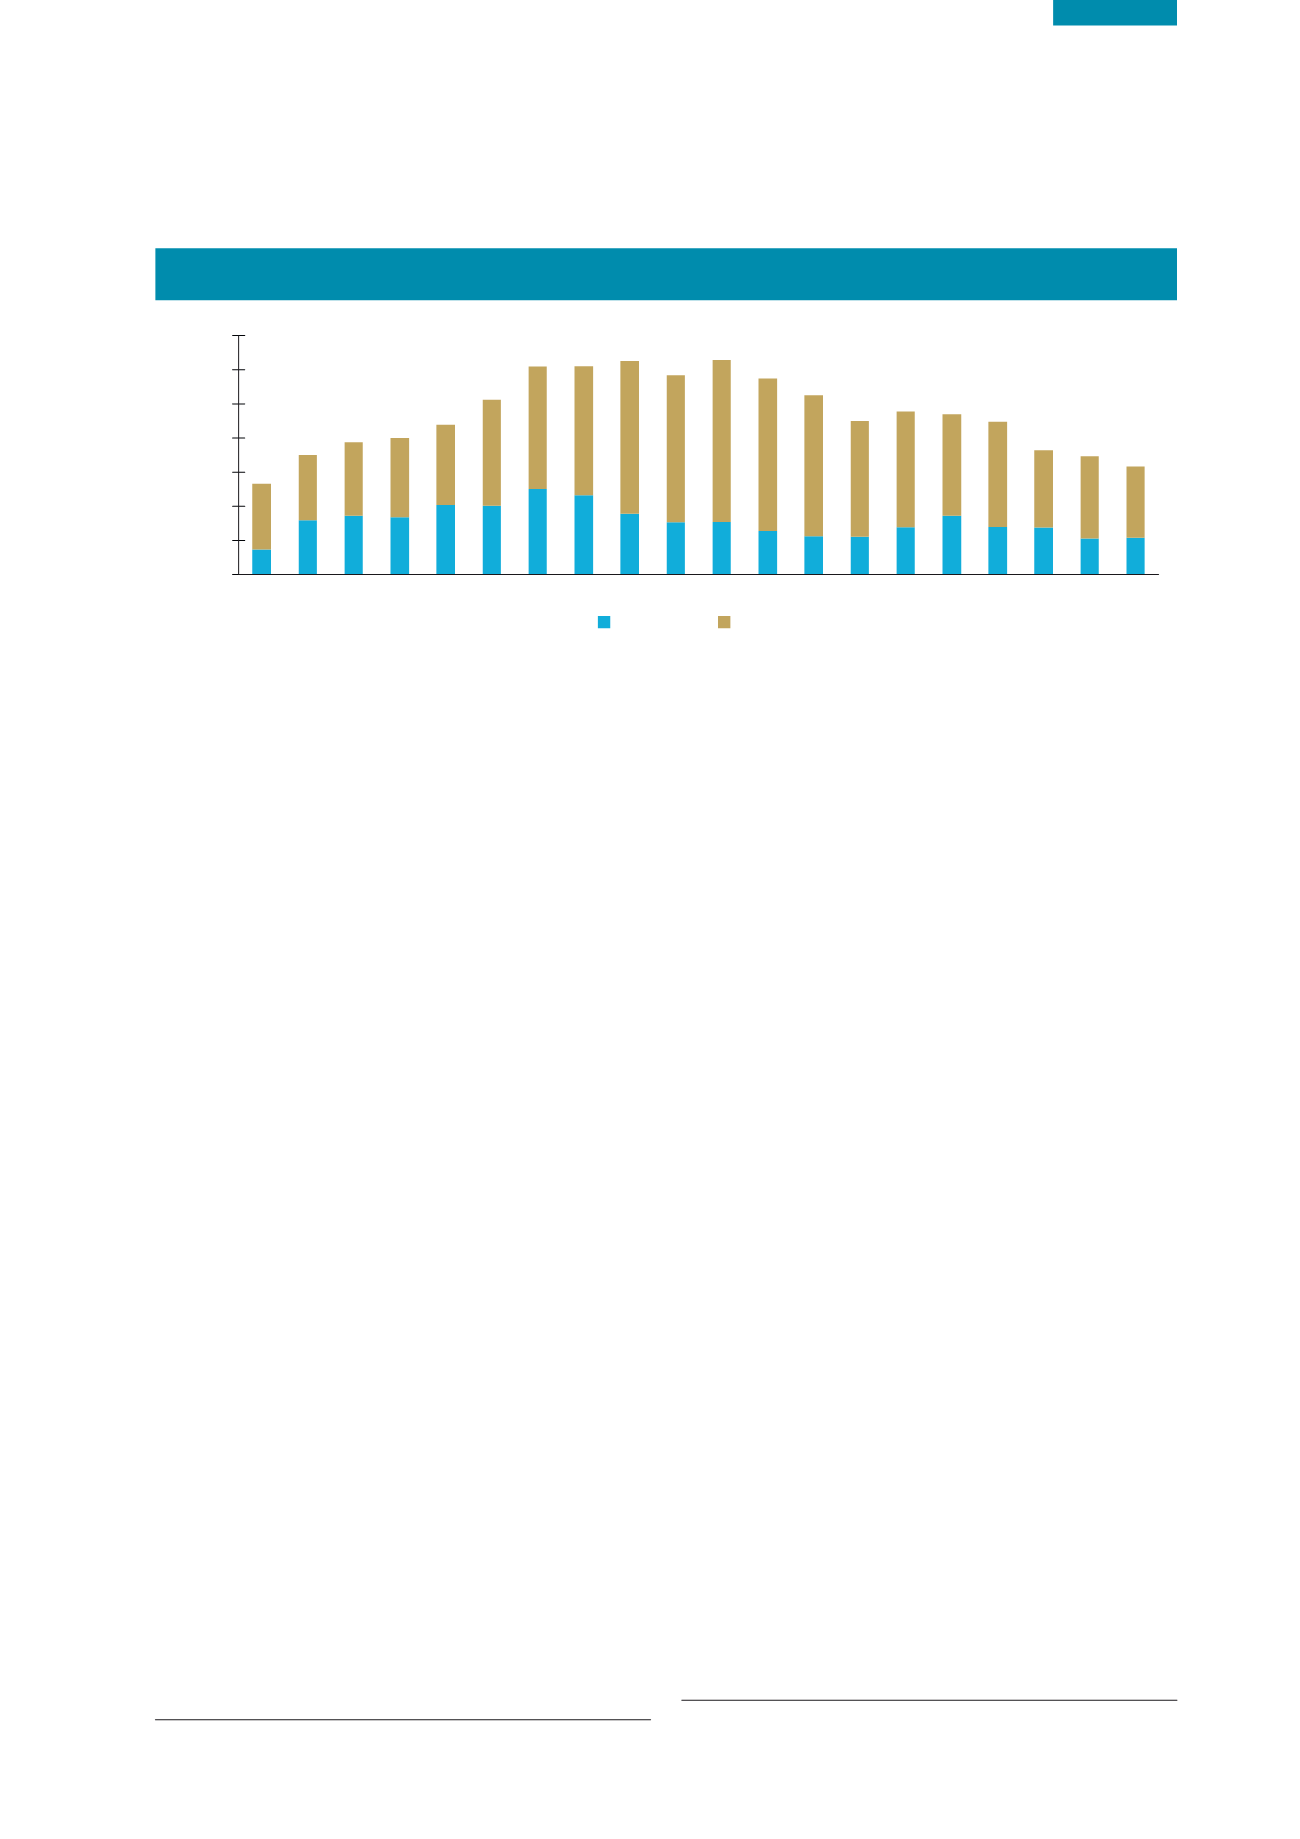
www.agriculture.gov.ie/publications/2011/ annualreviewandoutlookforagriculturefisheriesandfood20102011/ nationaldevelopments/foodharvest2020/Figure 5.8
Aquaculture Production Between 1990 and 2014 (Source: BIM)
0
10
20
30
40
50
60
70
Weight (Kt)
Finfish
Shellfish
2014
2013
2012
2011
2010
2009
2008
2007
2006
2005
2004
2003
2002
2001
2000
1999
1998
1997
1996
1990