


 74 / 234

Ireland’s Environment – An Assessment 2016
70
Transitional (Estuarine) and Coastal Waters
Ecological assessment covering the period between
2010 and 2015 indicate little change in the quality
of our transitional (estuarine) and coastal waters.
Preliminary results from a full 6-year ecological status
assessment covering the period between 2010 and 2015
indicate little change in the quality of our transitional
(estuarine) and coastal waters. A preliminary assessment
using information from all transitional and coastal
monitored water bodies was used to extrapolate the
results to unmonitored ones. For coastal waters, the
number of water bodies at High or Good status has
increased from 68% in 2012 to 76% in 2015 due to the
recovery of certain water bodies from algal bloom impacts.
In terms of surface area assessed there has been no
change with 93% of coastal water area at high or good
status. In transitional waters, 47% of water bodies remain
at moderate or worse status which is the same as was
found during the last assessment.
Lakes
An increase of 3% in the moderate or worse category
for lakes.
Preliminary results for 2013-2015 water status assessment
show 54% of monitored lakes are impacted (moderate
or worse ecological status) (EPA, 2016a). This represents
an increase of 3% in the moderate or worse category for
lakes compared with the baseline of 2007‑2009.
Groundwater
Only 1% of groundwater bodies have poor chemical
status because of elevated phosphorus levels or historical
contamination from mining activities and industrial
development (EPA, 2015b).
Overview of Water Quality Findings
Elevated nutrient concentrations (phosphorus and nitrogen)
continue to be the most widespread water quality problem
in Ireland, arising primarily from human activities such as
agriculture and waste water discharges to water from human
settlements, including towns, villages and rural houses. The
level of pollution from hazardous substances is low.
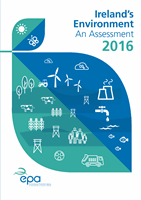
Figure 5.4
Trends in the 13,300km Baseline for Rivers Nationally in the Four EPA Biological Quality Classes Based
on the Macroinvertebrate Q Value Method Results (Source: EPA, 2016a)
0
10
20
30
40
50
60
70
80
90
Class A: Unpolluted
Class B: Slightly Polluted
Class C: Moderately Polluted
Class D: Seriously Polluted
1987-1990
1995-1997
1991-1994
1998-2000
2001-2003
2004-2006
2007-2009
2010-2012
2013-2015
% surveyed channel length
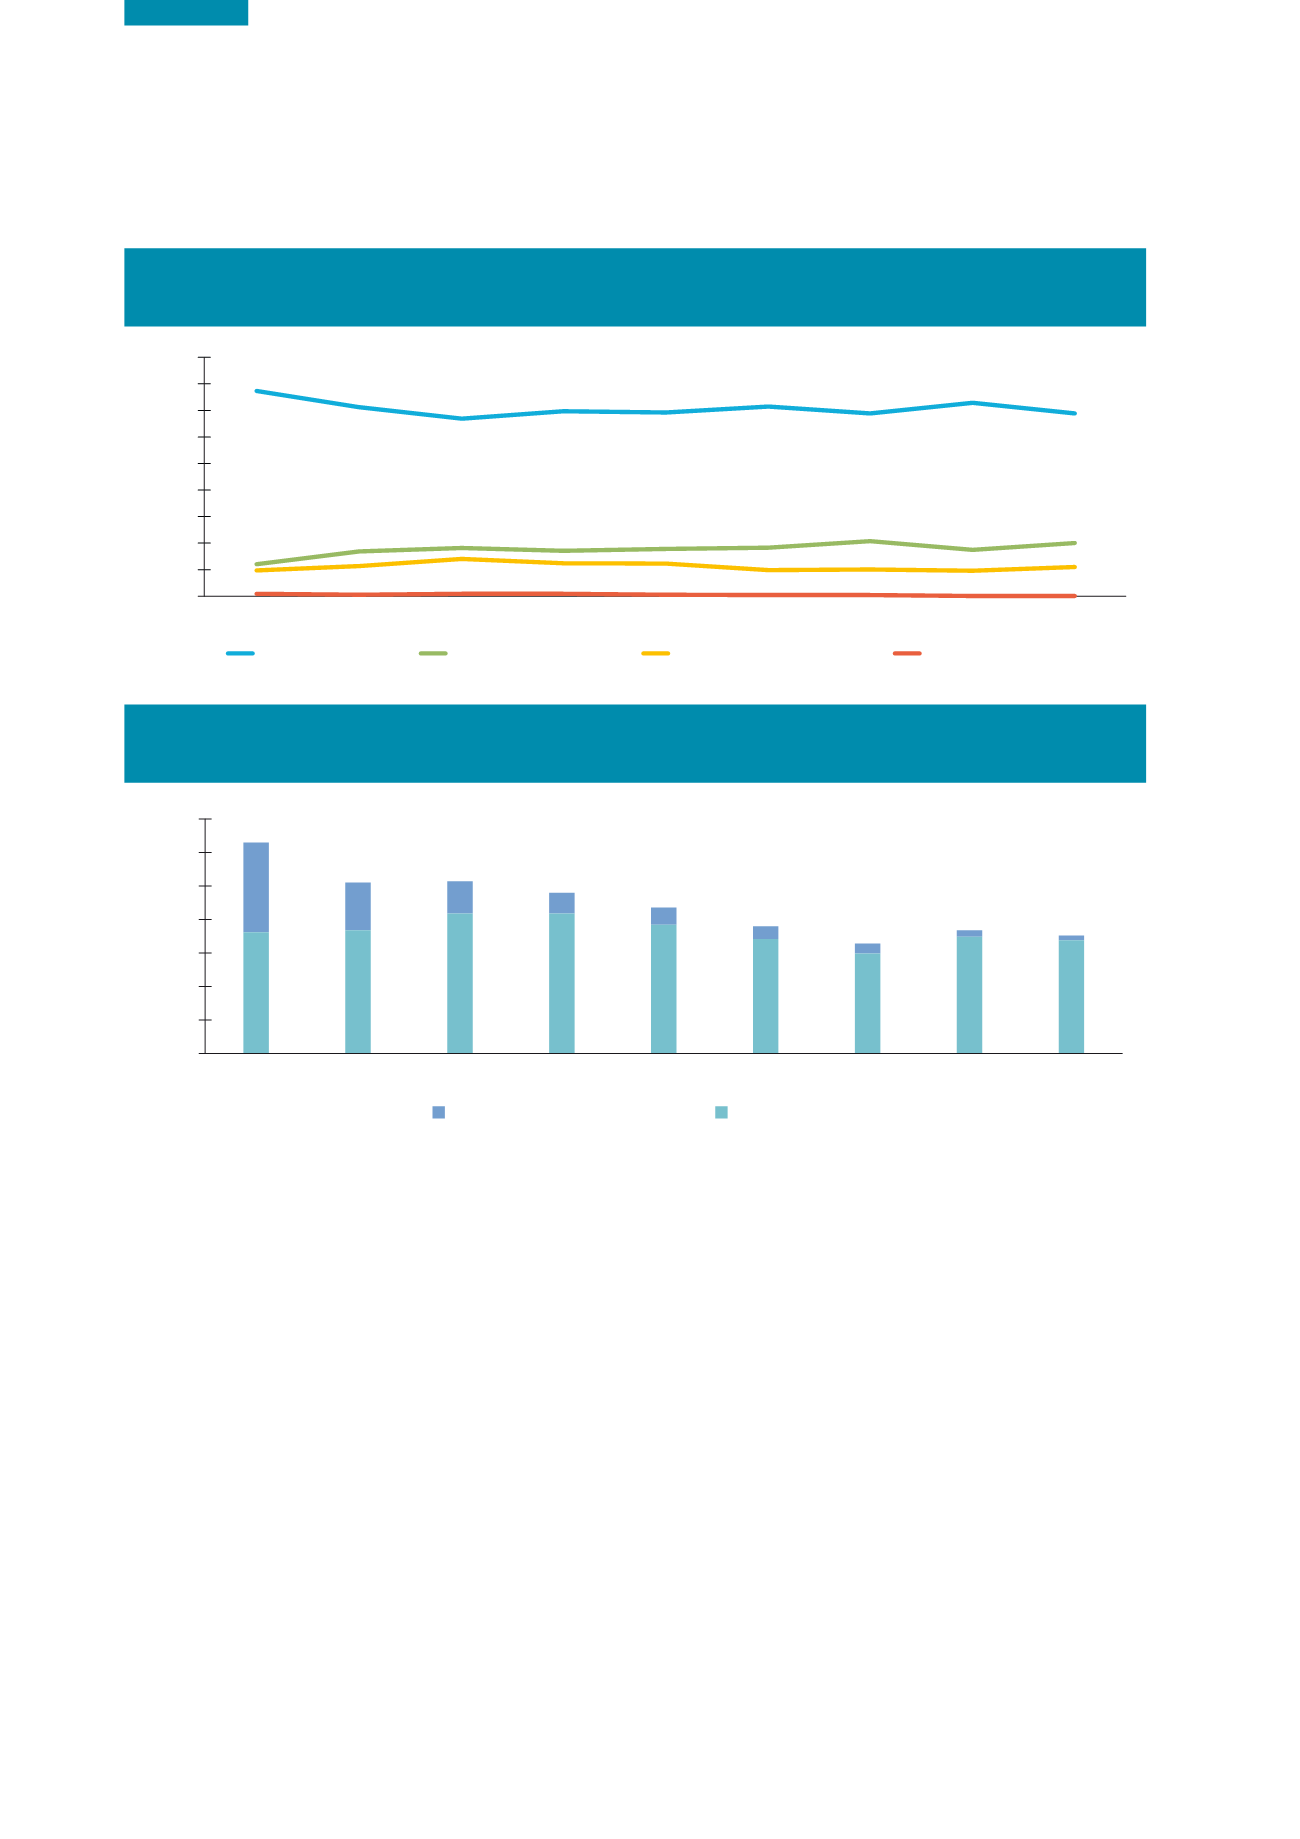
Figure 5.5
Long Term Trends (1987-2015) in the Percentage Number of High Ecological Quality
(Macroinvertebrate) River Sites (Q5 and Q4-5) in Each Survey Period (Source: EPA, 2016a)
0
5
10
15
20
25
30
35
2013-2015
2010-2012
2007-2009
2004-2006
2001-2003
1998-2000
1995-1997
1991-1994
1987-1990
% Q4-5 sites High Status
% Q5 Highest Quality River Sites
% number of monitored sites at High status
0.7
1.0
1.5
1.9
2.6
3.1
4.8
7.1
13.4
16.9
17.4
14.9
17.1
19.2
20.9
20.9
18.4
18.1