


 168 / 234

Ireland’s Environment – An Assessment 2016
164
Current Trends
Transport Emissions
Transport is a significant contributor to Ireland’s
greenhouse gas emissions.
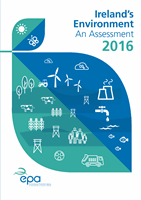
Transport was responsible for 19.5% of Ireland’s total GHG
emissions in 2014 (EPA, 2016a). Transport emissions grew
considerably between 1990 and 2007. By 2007, emissions
were up to 180% higher than in 1990. However, the
economic downturn meant that emissions from transport
decreased by 25% from 2007 to 2012. Changes to
emissions-based motor and vehicle registration taxes also
had an influence on this reduction, as did EU emissions
limits. For people with options for commuting, other than
by car, the introduction of carbon taxes also had some
effect though in the short-term at least fuel consumption
remains relatively static.
Since 2012, with a resumption of economic growth,
transport emissions have started to rise again (Figure
10.1). GHG emissions, including CO
2
, are projected to
increase by at least a further 10% by 2020 (EPA, 2016b).
This increase could be even higher, as it is based on an
assumption that there will be 50,000 electric vehicles on
the road and that the 10% renewable fuel use target
has been met. There are currently only around 1,700
electric vehicles on the road, highlighting the scale of the
challenges to be addressed in the transport sector.
Air Pollution and Transport
Air pollutants released from transport are a key public
health issue.
The impact of air pollution arising from transport
emissions on the environment and health is covered in
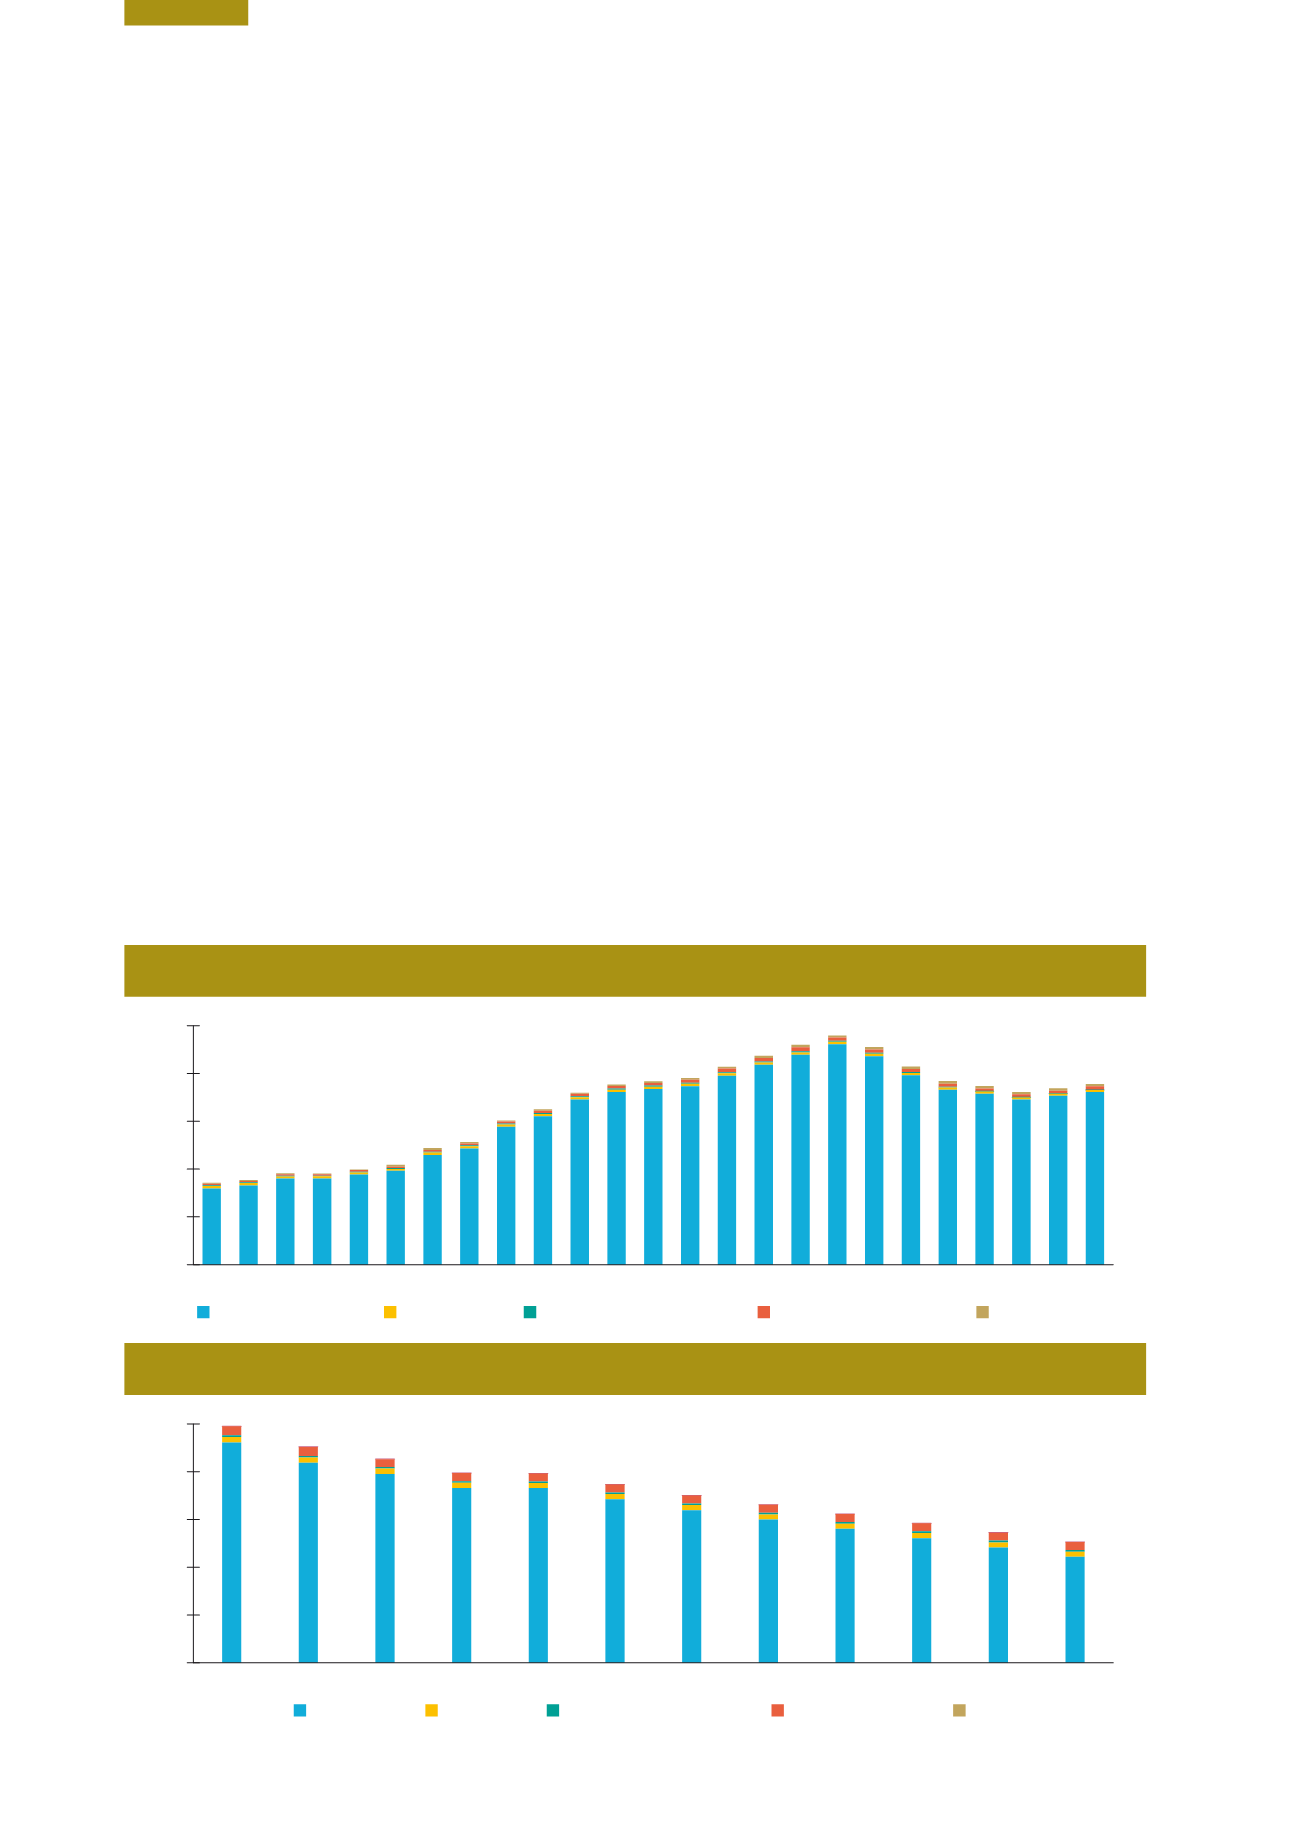
Chapter 2 of this report. The transport sector accounted
for 12% of all air pollutant emissions in 2015 and is
one of the largest contributors to particulate matter
pollution in cities (Figure 10.2). The diesel car fleet is a
key source of this particulate pollution. The predominant
message is that there are significant human health
impacts from particulate matter (PM) and nitrogen
oxides (NO
x
) emissions, which include cardiovascular
disease, lung disease and heart attacks (EPA, 2015), and
this points to a clear need to reduce transport-related
pollution emissions. The recent controversy over the
misrepresentation of NO
x
concentrations in car emissions
serves to underline the importance of industry integrity
and transparency, as well as the need for independent
validation of standards necessary to ensure protection of
public health.
Figure 10.2
Particulate Matter (PM
2.5
) Inventories and Projections by Transport Type, 2009‑2020 (Source: EPA)
0.0
0.5
1.0
1.5
2.0
2.5
2020
2019
2018
2017
2016
2015
2014
2013
2012
2011
2010
2009
Other
National Nav
Aviation (Domestic)
Gg is gigagrams, which is equivalent to kt (kilotonnes).
Rail
Road
Gg PM
2.5
Figure 10.1
Transport Greenhouse Gas Emissions, 1990‑2014 (Source: EPA)
0
3
6
9
12
15
2014
2013
2012
2011
2010
2009
2008
2007
2006
2005
2004
2003
2002
2001
2000
1999
1998
1997
1996
1995
1994
1993
1992
1991
1990
Gas Transmission
Domestic Navigation
Domestic Civil Aviation
Railways
Road Transport
Mt CO
2
eq