


 170 / 234

Ireland’s Environment – An Assessment 2016
166
Road Freight
Road freight is projected to increase again as the
economy grows.
There was significant growth in the number of heavy
goods vehicles (HGVs) from 1990 onwards. The estimated
energy demand of Irish road freight between 1990 and
2007 increased by 239% (SEAI, 2014a). However, the
estimated final energy demand of HGVs was down 49%
in the period 2007 to 2013, and HGVs have become much
more fuel efficient due to more stringent EU standards.
Nevertheless, the energy demand from HGVs has now
started to increase again which clearly indicates that
economic activity is a significant factor when it comes to
road freight based emissions.
Rail and Bus
The challenge is to increase passenger numbers to
reduce car dependency.
Rail freight traffic declined by 83% over the period 1990 –
2014, from 589 million tonne-kilometre (tkm) in 1990 to
100 million tkm in 2014, although since 2012 it has been
increasing. While the demand for rail freight has declined
over the period, combined rail and road freight has increased
significantly which indicates a very significant modal shift
to road freight. The CO
2
emissions profile for rail freight
could be up to 90% less than that for road freight with the
new longer trains under trial, while any CO
2
emissions from
electric trains would be minimal (Irish Rail, 2016).
The total number of heavy rail passengers dropped from
44.7 million in 2008 to 36.7 million in 2013 in line with
economic and transport demand decline. Recent years have
seen a renewed growth in rail passengers. Meanwhile, the
Luas has experienced consistent passenger growth since
2009, with provisional figures indicating that 34.6 million
passengers used this service in 2015, which is 9.2 million
higher than in 2009. Bus vehicle kilometres increased by
39% from 1998 to 2008, before falling back by 10% from
2008 to 2012. The total kilometres operated remained
constant between 2013 and 2014 at 163.6 million vehicle
km, with a small decline in both Dublin Bus and Bus Éireann
public service obligation (PSO) services balanced by a small
increase in other services (DTTAS, 2015b).
Cycling
Cycling in cities has recorded steady growth.
The number of journeys on the Dublin Bikes scheme,
which began operations in Dublin in 2009, increased from
1.2 million in 2010 to 4.1 million in 2015. There are now
similar schemes in operation in Cork, Limerick and Galway.
The number of journeys in 2015 was 289,426 in Cork,
40,118 in Limerick and 19,934 in Galway. Cycling to work
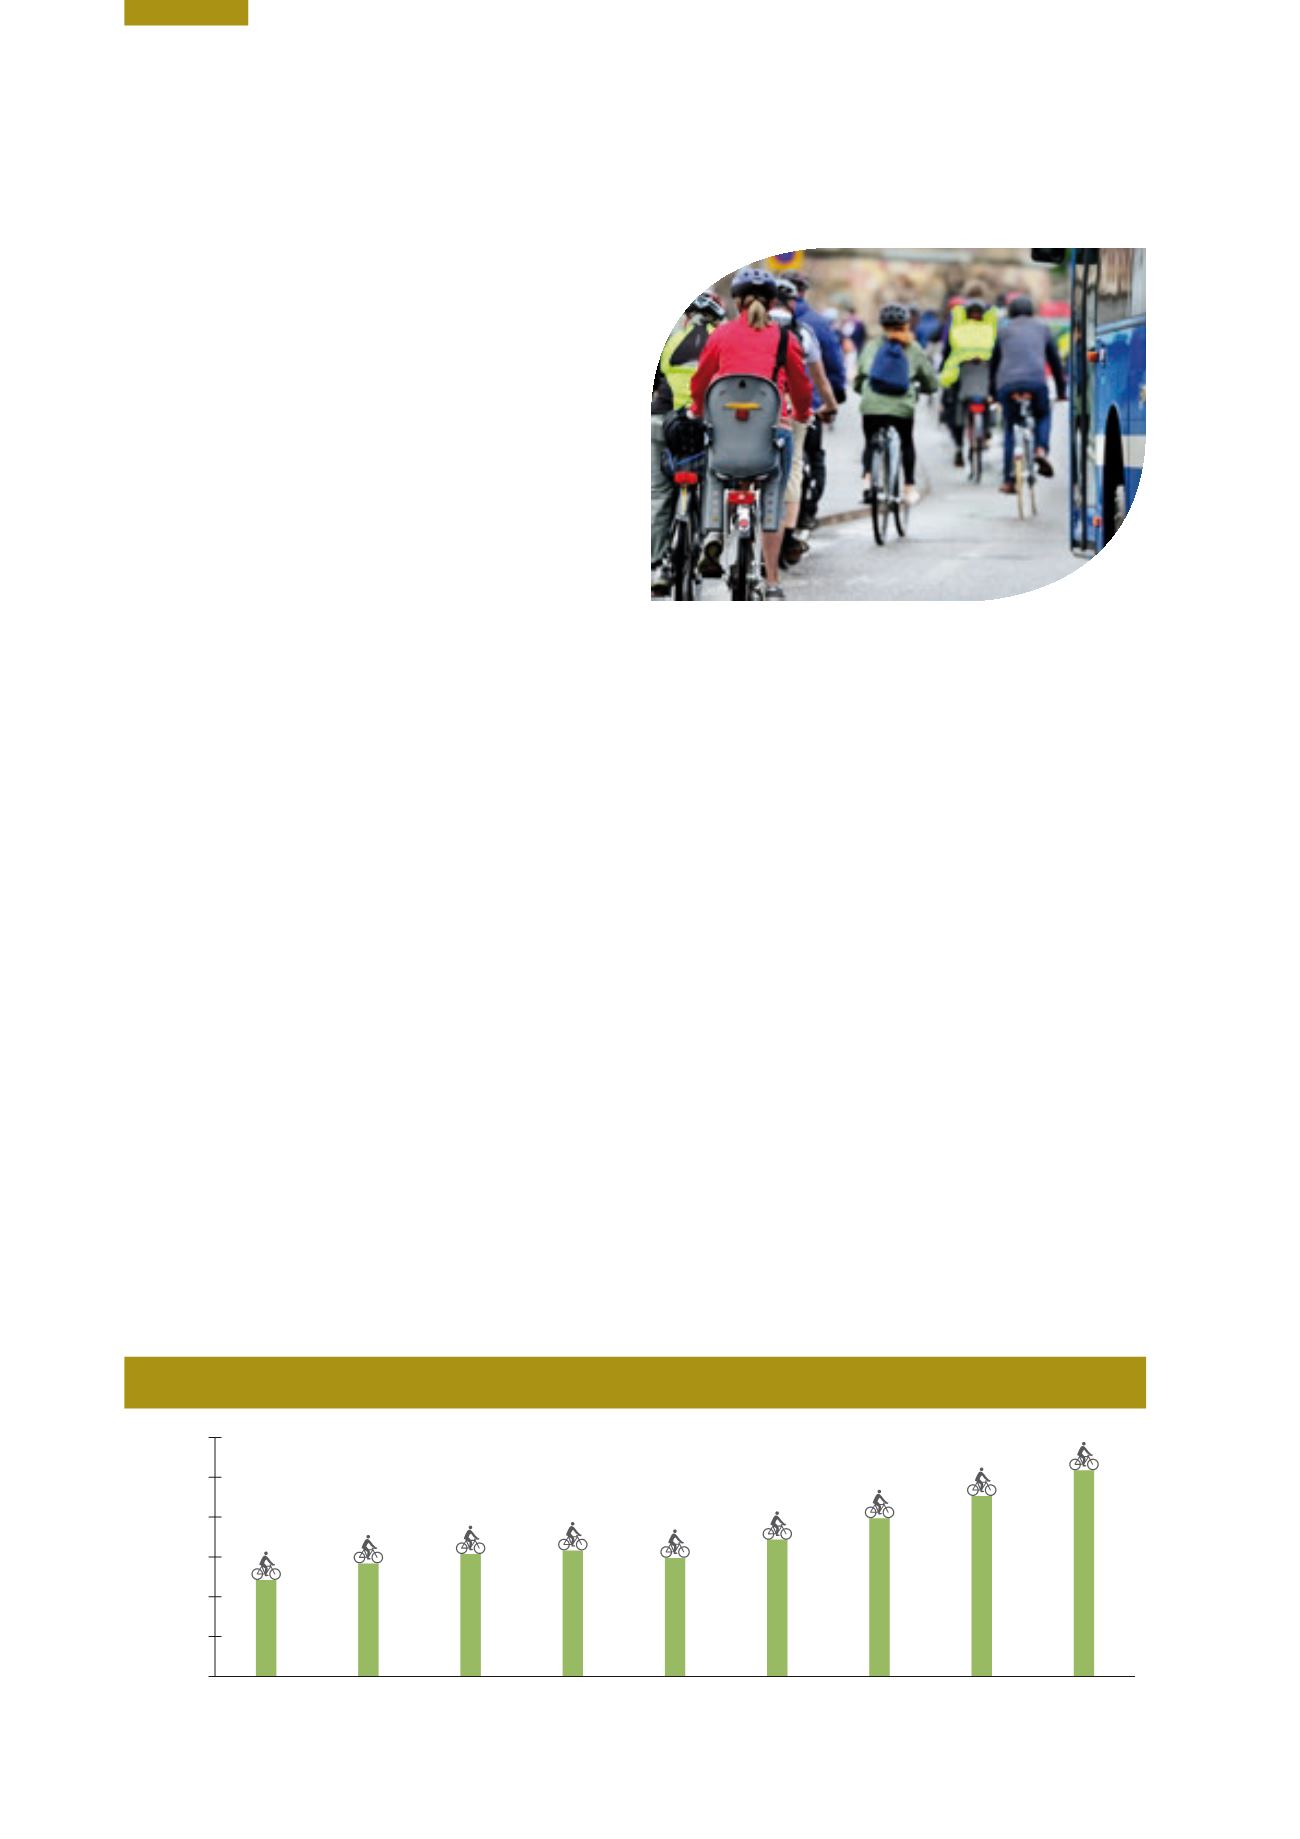
in Dublin has seen steady growth since 2006 based on
counters placed along the canals (Figure 10.5).
Aviation
Air transport passenger numbers are increasing.
Following a substantial drop in numbers from 2009 to
2011, the number of passengers handled by Irish airports
has rebounded again to reach 26.5 million in 2014, with
the upward trend likely to continue for some time to
come. The energy demand of aviation is estimated based
on the sales of jet kerosene. Between 1990 and 2007,
estimated aviation energy demand grew by 179%, from
Figure 10.5
Cyclists Crossing the Canal Cordon in the Morning (a.m.) Peak (Source: DTA)
0
2,000
4,000
6,000
8,000
10,000
12,000
2014
2013
2012
2011
2010
2009
2008
2007
2006
Number of Cyclists