


 171 / 234

167
Chapter 10: Environment and Transport
375 kilo-tonnes of oil equivalent (ktoe) to 1045 ktoe (1 toe
is the amount of energy released by burning 1 tonne of
crude oil). This was followed by a decline of 44% up to
2012, while 2013 saw an increase of 3.4% to 607 ktoe,
and this upward trend is continuing.
Marine and Navigation
Tonnages handled by Irish ports, while increasing in
2014, were still 12% below 2007 levels. The number of
vessels handled was 24% lower in 2014, suggesting a
move towards fewer larger vessels. This transport sector
involving Ireland’s cargo ships and tankers is simply known
as “navigation”. Navigation energy demand is estimated
based on sales of marine diesel. For the period 1990 to
2013, the estimated energy demand increased from a low
base in the early 1990s of approximately 7 ktoe to a peak
of 81 ktoe in 2008, declining to 57 ktoe in 2013. The
trend for energy demand in this mode is currently poorly
understood.
What’s Being Done
Energy Efficiency
Initiatives to increase energy efficiency in the
transport sector are in progress.
Ireland’s third National Energy Efficiency Action
Plan (NEEAP) was launched by the Department of
Communications, Energy and Natural Resources (DCENR)
in 2014. The NEEAP sets out a suite of policies and
measures to deliver savings resulting from energy efficiency.
The transport sector accounts for 14% of the total
energy efficiency savings identified. The majority of the
energy savings (66%) are expected to come from the EU
regulations on improved fuel economy of new private cars,
but this assumes that the energy efficiency figures supplied
by the various vehicle manufacturers can be validated.
According to research by the International Council on
Clean Transportation (ICCT), real-world emissions of CO
2
are up to 40% higher than emissions measured in the
testing lab, with the largest discrepancy observed in hybrid
cars (EEA, 2016).
The charging system for Vehicle Registration Tax (VRT)
and motor tax for private vehicles continues to promote
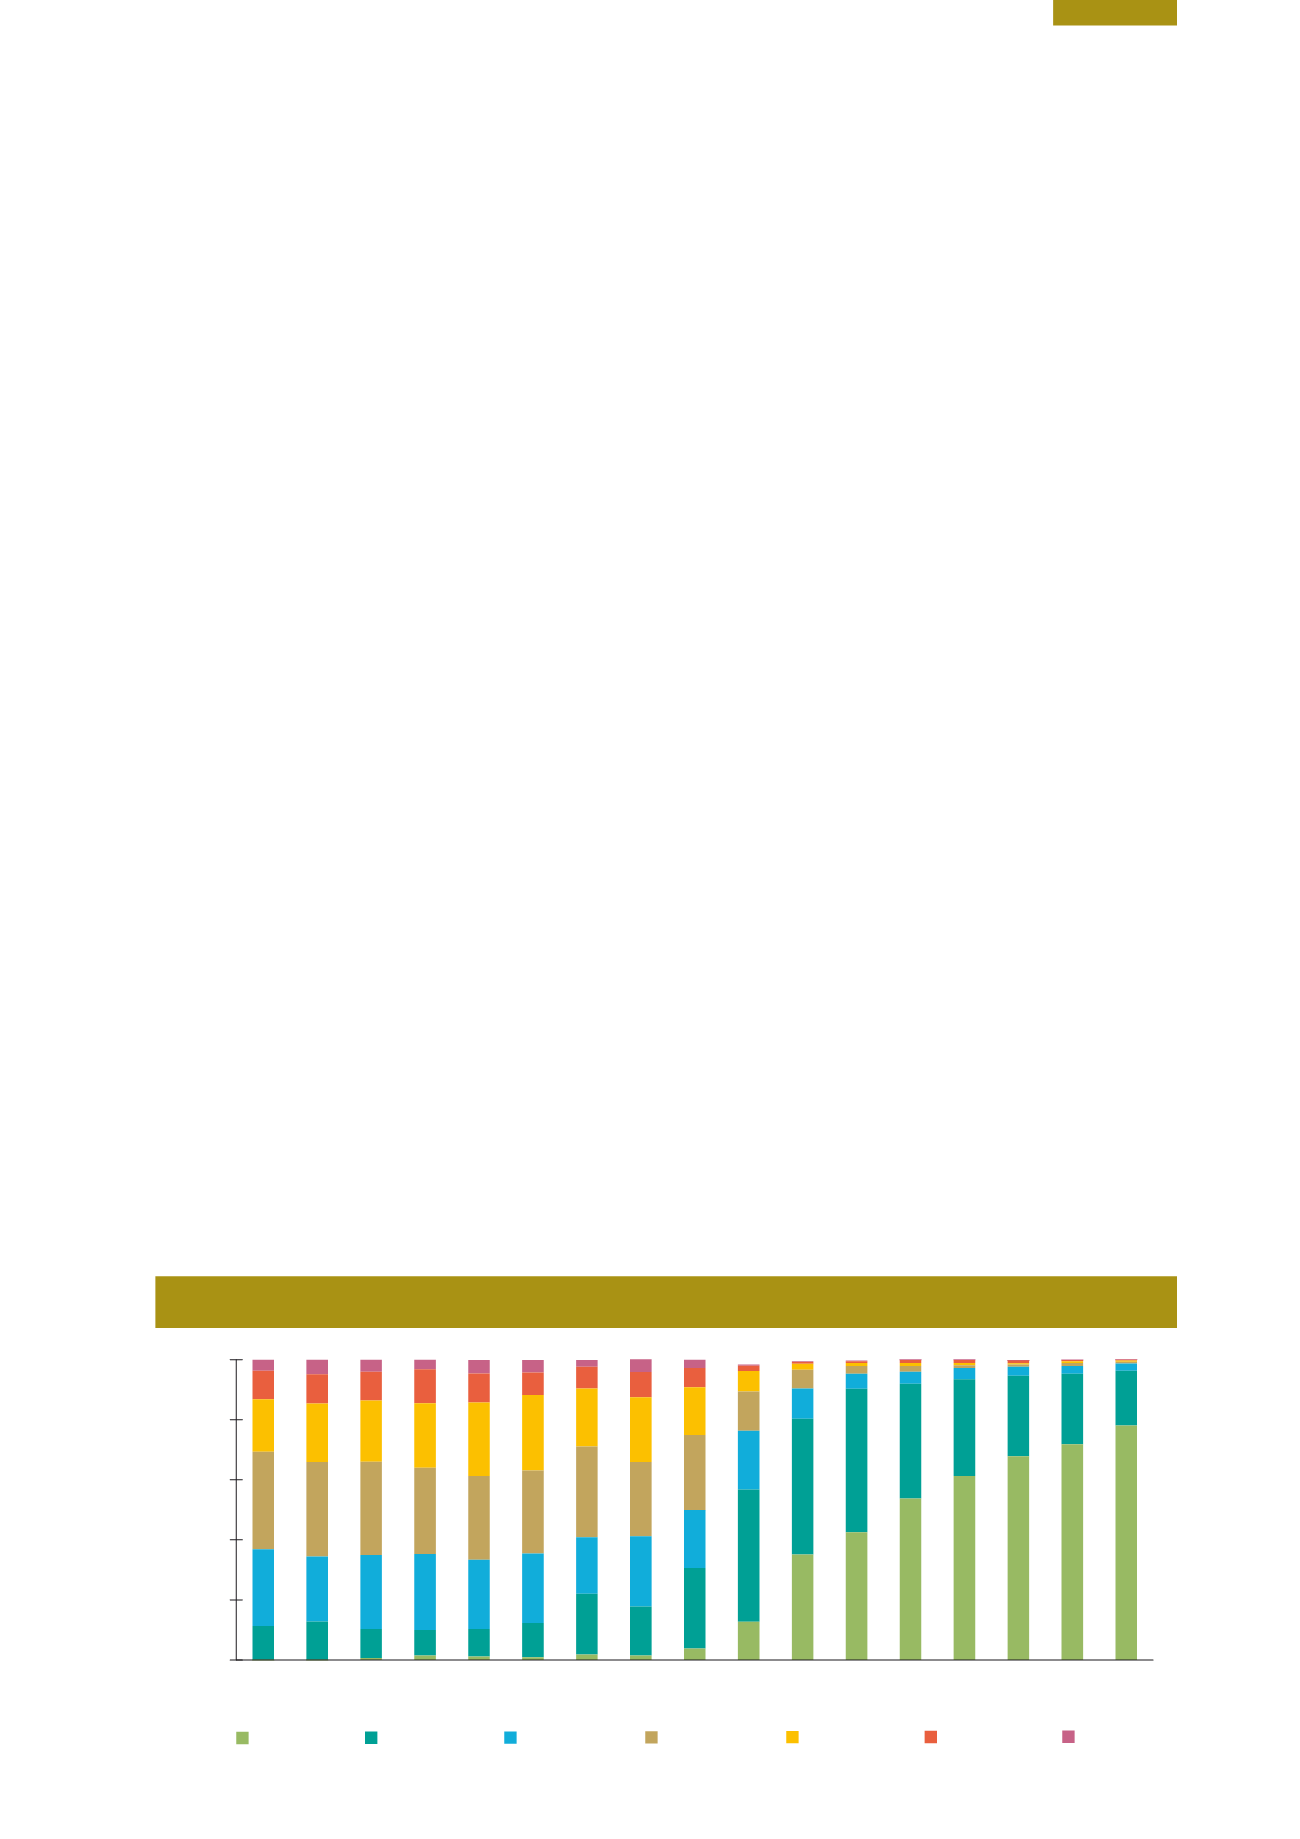
the purchase of energy-efficient vehicles. In 2013, 61%
of new purchases were in Band A (1–120 g/km) and 32%
were in Band B (121–140 g/km), while cars with CO
2
emissions of 140 g/km or higher accounted for just 7% of
new car purchases (Figure 10.6). Whilst a successful policy
from the perspective of CO
2
, this tax transfer did lead to
higher environmental NO
x
and particulate emissions as
consumers migrated to low-CO
2
diesel cars. A significant
portion of the Irish passenger car (PC) fleet still uses older
exhaust emission reduction technologies, such as Euro II
(1997-2001) and III (2002-2005) , but this is changing as
newer technologies such as Euro IV and V become more
dominant (EPA-UNFCCC, 2016). The potential impacts,
particularly the effects of NO
x
emissions resulting from
continued dieselisation (increase in relative numbers of
diesel vehicles) on ambient pollutant levels and therefore
human health, are becoming more clearly understood and
must also be factored into policy development in this area.
The environmental efficiency of such a taxation measure is
therefore questionable.
Initiatives are under way to modernise the public transport
fleet by introducing reduced emission vehicles. There is a
commitment to establish a Green Bus Fund to cover the
differential between the cost of a conventional diesel bus
and the cost of an alternative fuelled equivalent. This,
and other transport measures, are included in the White
Paper on Energy Policy
Ireland’s Transition to a Low Carbon
Energy Future 2015‑2030,
which was published in 2015
(DCENR, 2015).
Figure 10.6
Share of New Cars by Emission Band (Source: SEAI 2014a Energy in Transport)
0%
20%
40%
60%
80%
100%
2016
YTD March
2015
2014
2013
2012
2011
2010
2009
2008
2007
2006
2005
2004
2003
2002
2001
2000
Shares of new private cars in each emissions label band
E (171-190)
B (121-140)
G (>225)
C (141-155)
A (<=120)
D (156-170)
F (191-225)