


 169 / 234

165
Chapter 10: Environment and Transport
Other Environmental Pressures
Noise pollution is an important health concern affecting
quality of life and wellbeing, and road transport is one
of the main sources of environmental noise pollution in
Europe, as outlined in Chapter 8 of this report. An example
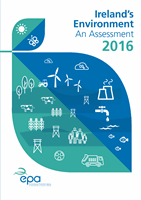
of transport noise mapping in cities in shown in Figure 10.3.
Land use planning to safeguard the protection of quiet areas
not yet affected by noise can bring significant environmental
health benefits. Other environmental aspects include the
significant impacts from large transport infrastructural
developments on both the human and natural environment,
such as on air quality, climate, land and soil.
Figure 10.3
Environmental Noise Map of Cork City
(Source: Cork City Council)
Passenger Road Transport
The car is still the dominant choice.
The private car remains the dominant mode of transport
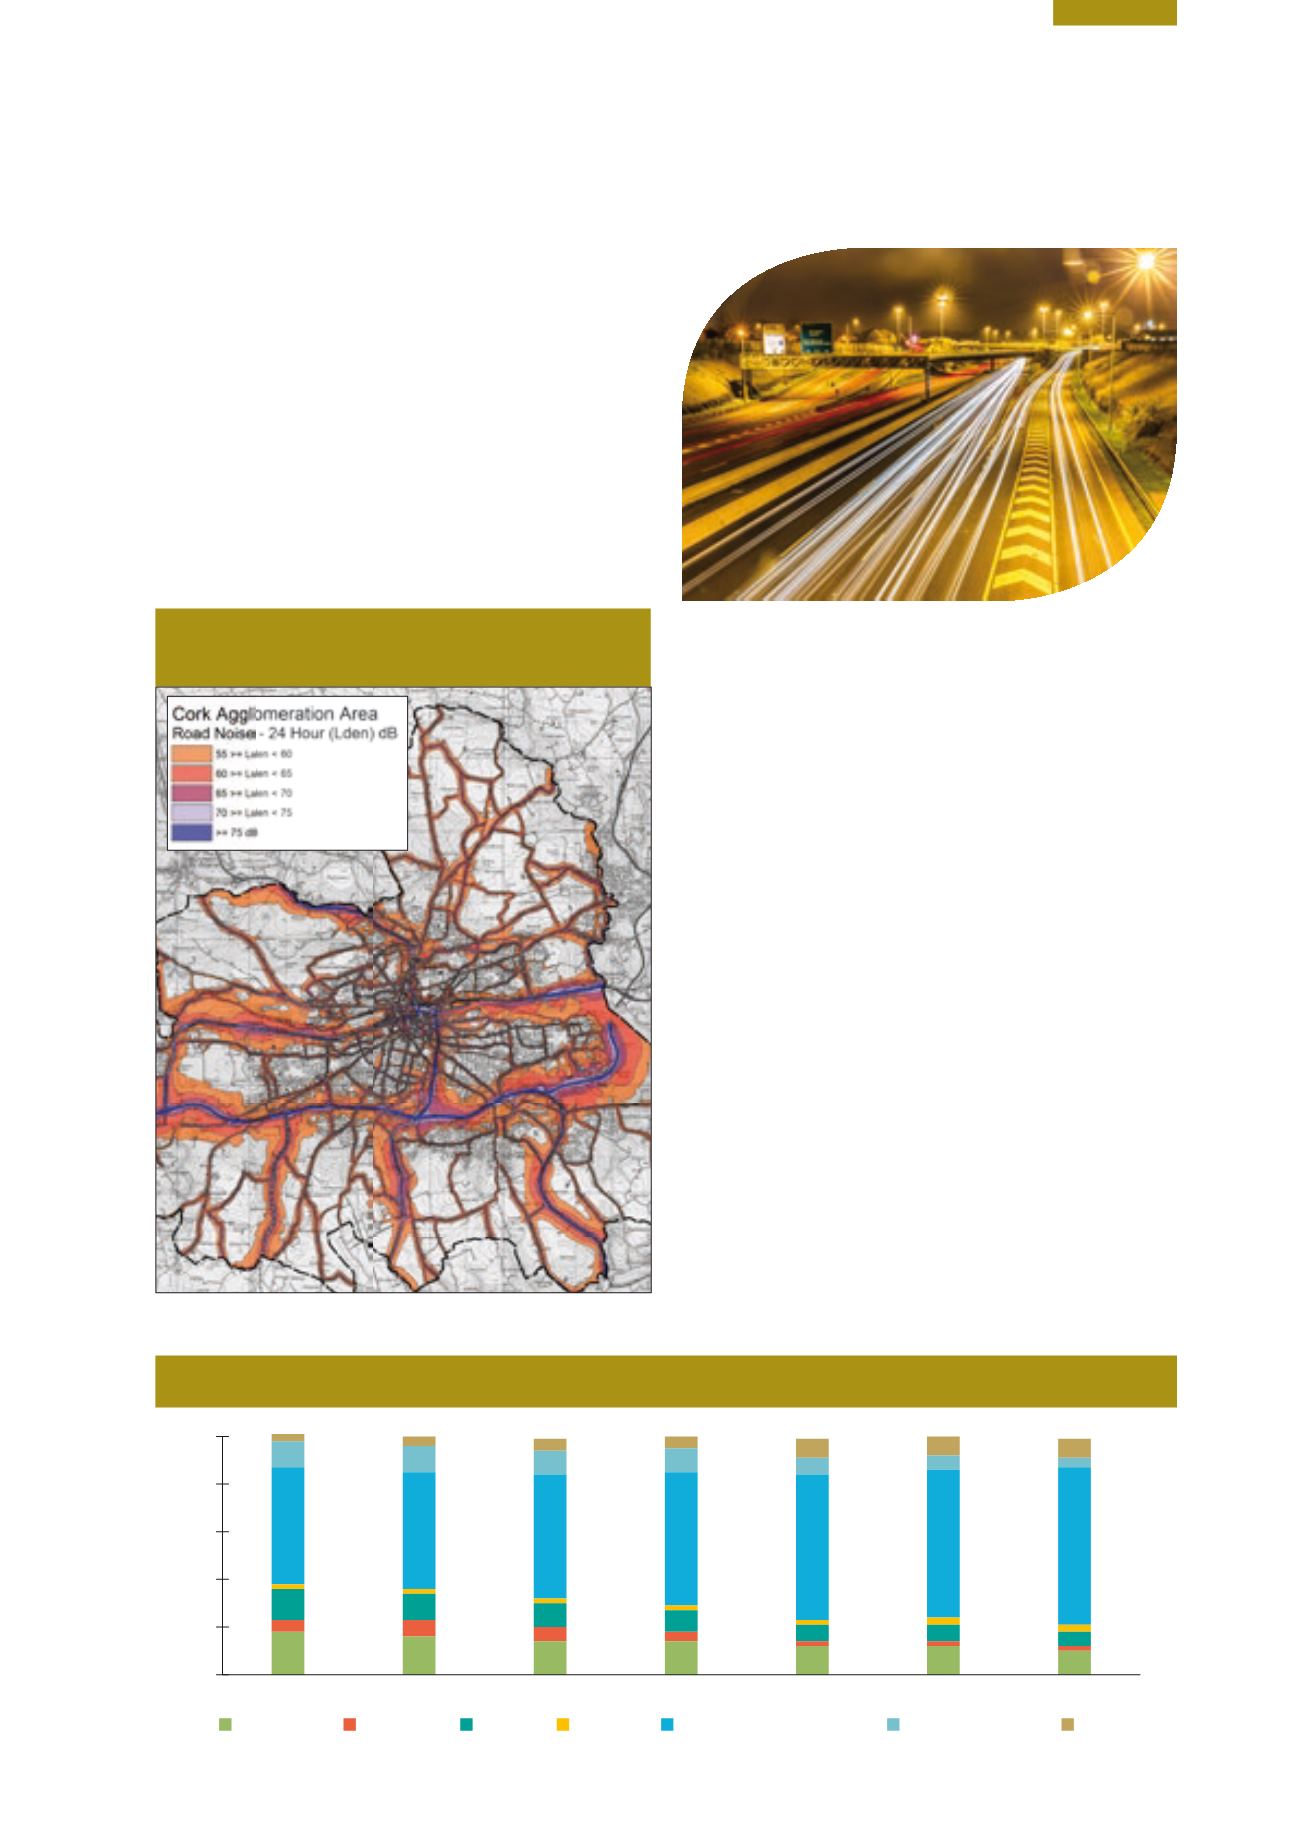
in Ireland, accounting, on average, for 74% of all journeys
(Figure 10.4) and 79% of all journeys outside Dublin (CSO,
2015). The dependency on car transport outside Dublin can
be partially explained by the low-density, dispersed nature
of the rural population, making it very difficult to effectively
operate a public transport service in rural Ireland. This high
dependency has a very significant environmental impact in
terms of both GHG and air pollutant emissions.
The total number of licensed vehicles on Irish roads
exceeded 2.5 million for the first time in 2014 (DTTAS,
2015a), which included over 1.9 million private cars. While
private car ownership levels in Ireland are still below the
EU average, the challenge for policymakers is to try to
develop a sustainable transport model that can meet the
Department of Transport, Tourism and Sport’s (DTTAS)
sustainable transport vision of:
n
maximising efficiency and alleviating congestion;
n
minimising the impacts of air pollutants and GHG
emissions; and
n
reducing overall travel demand and commuting
distances by private car.
Figure 10.4
Travel to Work by Mode (Source: CSO)
0%
20%
40%
60%
80%
100%
Other
Car (passenger)
Car/Motor-cycle (driver)
Train
Bus
Bicycle
On foot
2011
2006
2002
1996
1991
1986
1981