


 114 / 234

Ireland’s Environment – An Assessment 2016
110
Land Cover Data Reporting Variation
CORINE data are presented at a baseline resolution of
25ha for all land cover classes. Where more detailed
sectoral data are available, these are referred to in the
sections below. Although it may appear that some
CORINE data values are contradictory, this is simply
the result of variations in the quality and extent of
data available or the mapping resolution used.
Agriculture
Agriculture accounts for the majority of national
land use.
Agriculture accounts for 67.36% of the national land cover.
The main agricultural class is pasture (54.67% national land
cover), followed by land principally occupied by agriculture
(primarily pasture), which is interspersed with areas of
natural vegetation (6.99%), arable land (4.85%) and areas
with complex cultivation patterns (0.84%) (EPA, 2014a).
Analysis of LULC change between 2006 and 2012 shows
that the primary agricultural changes were as expected,
with an internal class change from pasture to arable and
vice versa (38.49% of total national change), followed
by afforestation of pasture lands (8.32%). The balance of
change between agricultural classes has resulted in only a
small reduction (-0.11%) since 2006.
Teagasc’s Soil Quality Assessment Research Project
describes that “the objectives of Food Harvest 2020
place a demand on soils to support the intensification
of agriculture to meet global food security objectives.
Simultaneously, greening objectives of the Common
Agricultural Policy insist that increases in production must
be achieved in a sustainable manner”.
Peatlands
Peatlands provide a range of environmental benefits.
Peatlands provide a range of functions, including
maintaining biodiversity and water quality, carbon storage
and sequestration, agriculture, forestry, water regulation,
recreation and flood attenuation. According to the Rural
Development Programme (DAFM, 2014a), peat soils cover
20.6% of Ireland’s land area. Near-intact peatlands may
actively sequester, on average, 57,400 tonnes of carbon
per year over the whole country. The National Peatlands
Strategy (DAHG, 2015a) sets out how to sustainably manage
and protect/conserve our national peatland resource. This
strategy estimated that Irish peatlands store some 1,566
million tonnes of carbon, representing approximately 64% of
the total soil organic carbon stock present in Ireland.
Forestry
Forestry levels in Ireland are low compared with the EU.
Forests provide many environment-related functions,
including carbon sequestration and storage, water
regulation and support for biodiversity, in addition to their
commercial value. Ireland’s National Forestry Programme
2014‑2020 has identified four key needs for Ireland’s
forestry sector. These are (1) permanently increasing
Ireland’s forest cover, (2) increasing and sustaining forest-
based biomass production to meet renewable energy
targets, (3) supporting forest holders in actively managing
their plantations and (4) optimising the environmental and
social benefits of new and existing forests. To meet these
needs, a series of “woodland and afforestation” schemes
have been prepared by the Department of Agriculture,
Food and the Marine (DAFM). This afforestation scheme
requires a minimum 10% broadleaf component to be
included. In addition, a national broadleaf target of 30%
has been set for the overall “Afforestation and Creation of
Woodland” measure in the National Forestry Programme.
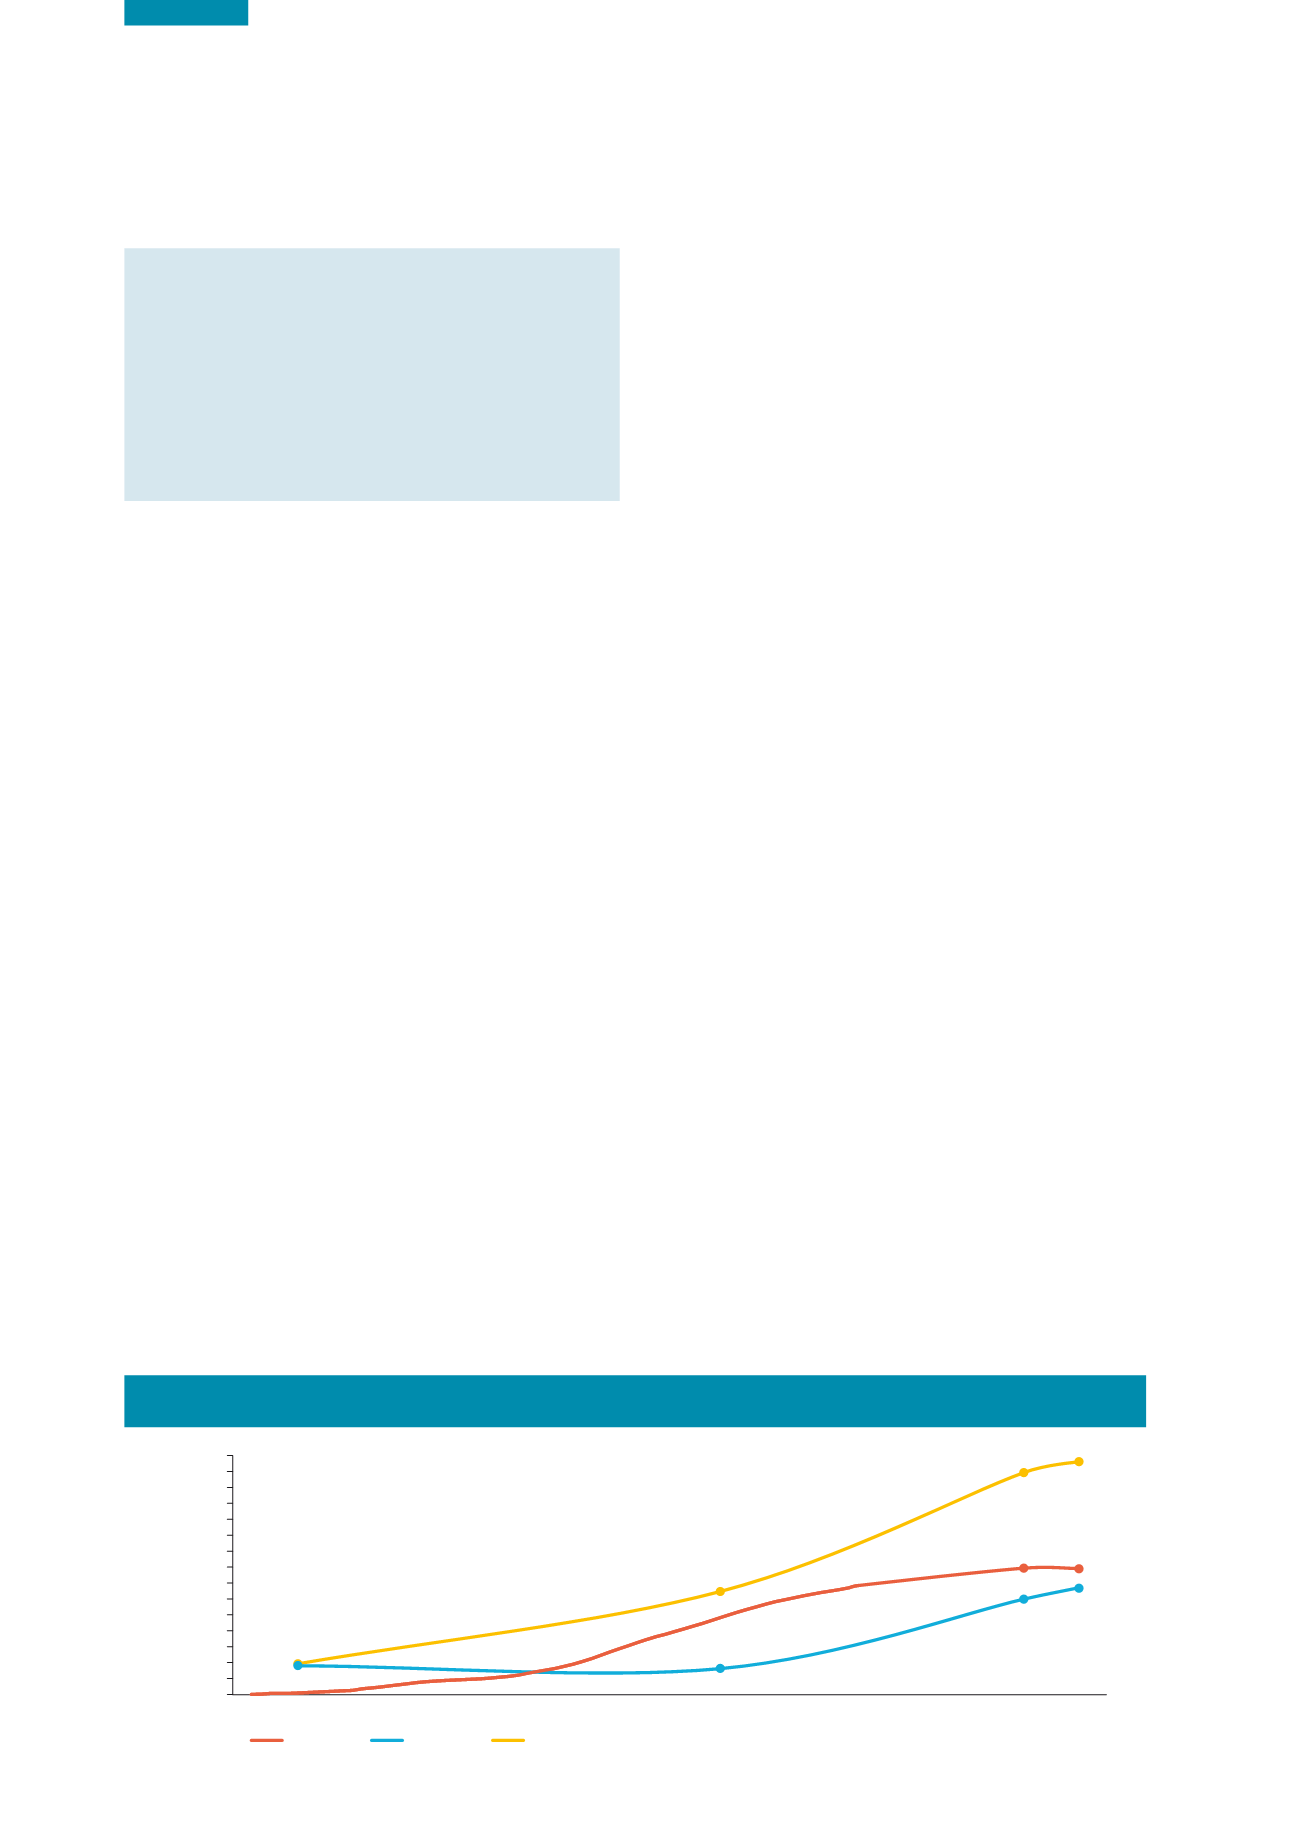
Ireland’s 2015 Forestry Annual Statistics Report (DAFM,
2015b) describes forest cover to be at its highest level
in over 350 years, with forestation estimated at 10.5%
of the total land area. Despite this, Ireland still has one
of the lowest afforestation levels in the EU. The national
forest estate is an important carbon reservoir, amounting
to 381 million tonnes of carbon in 2012, an increase
from 348 million tonnes in 2006. The Rural Development
Programme 2014‑2020 (DAFM, 2014a) also reports that
Figure 7.3 Forest Area Change, 1922‑2014 (Source: DAFM, 2014b)
0
50,000
100,000
150,000
200,000
250,000
300,000
350,000
400,000
450,000
500,000
550,000
600,000
650,000
700,000
750,000
1920 1925 1930 1935 1940 1945 1950 1955 1960 1965 1970 1975 1980 1985 1990 1995 2000 2005 2010 2015
Area (ha)
Public
Total
Private