


 113 / 234

109
Chapter 7: Land and Soil
Table 7.1
2012 CORINE Land Cover, Land Use and Land Use Change (Source: EPA, 2014a)
CORINE land cover and land use classes
CORINE 2012 summary
% of national
area
% change
since 2006
% change
since 1990
Agricultural areas
67.36%
-0.11%
-0.11%
Wetlands
15.56%
-0.04%
-2.95%
Forest
9.37%
0.11%
2.05%
Semi-natural and low vegetation
3.16%
0.00%
0.27%
Artificial surfaces
2.46%
0.04%
1.01%
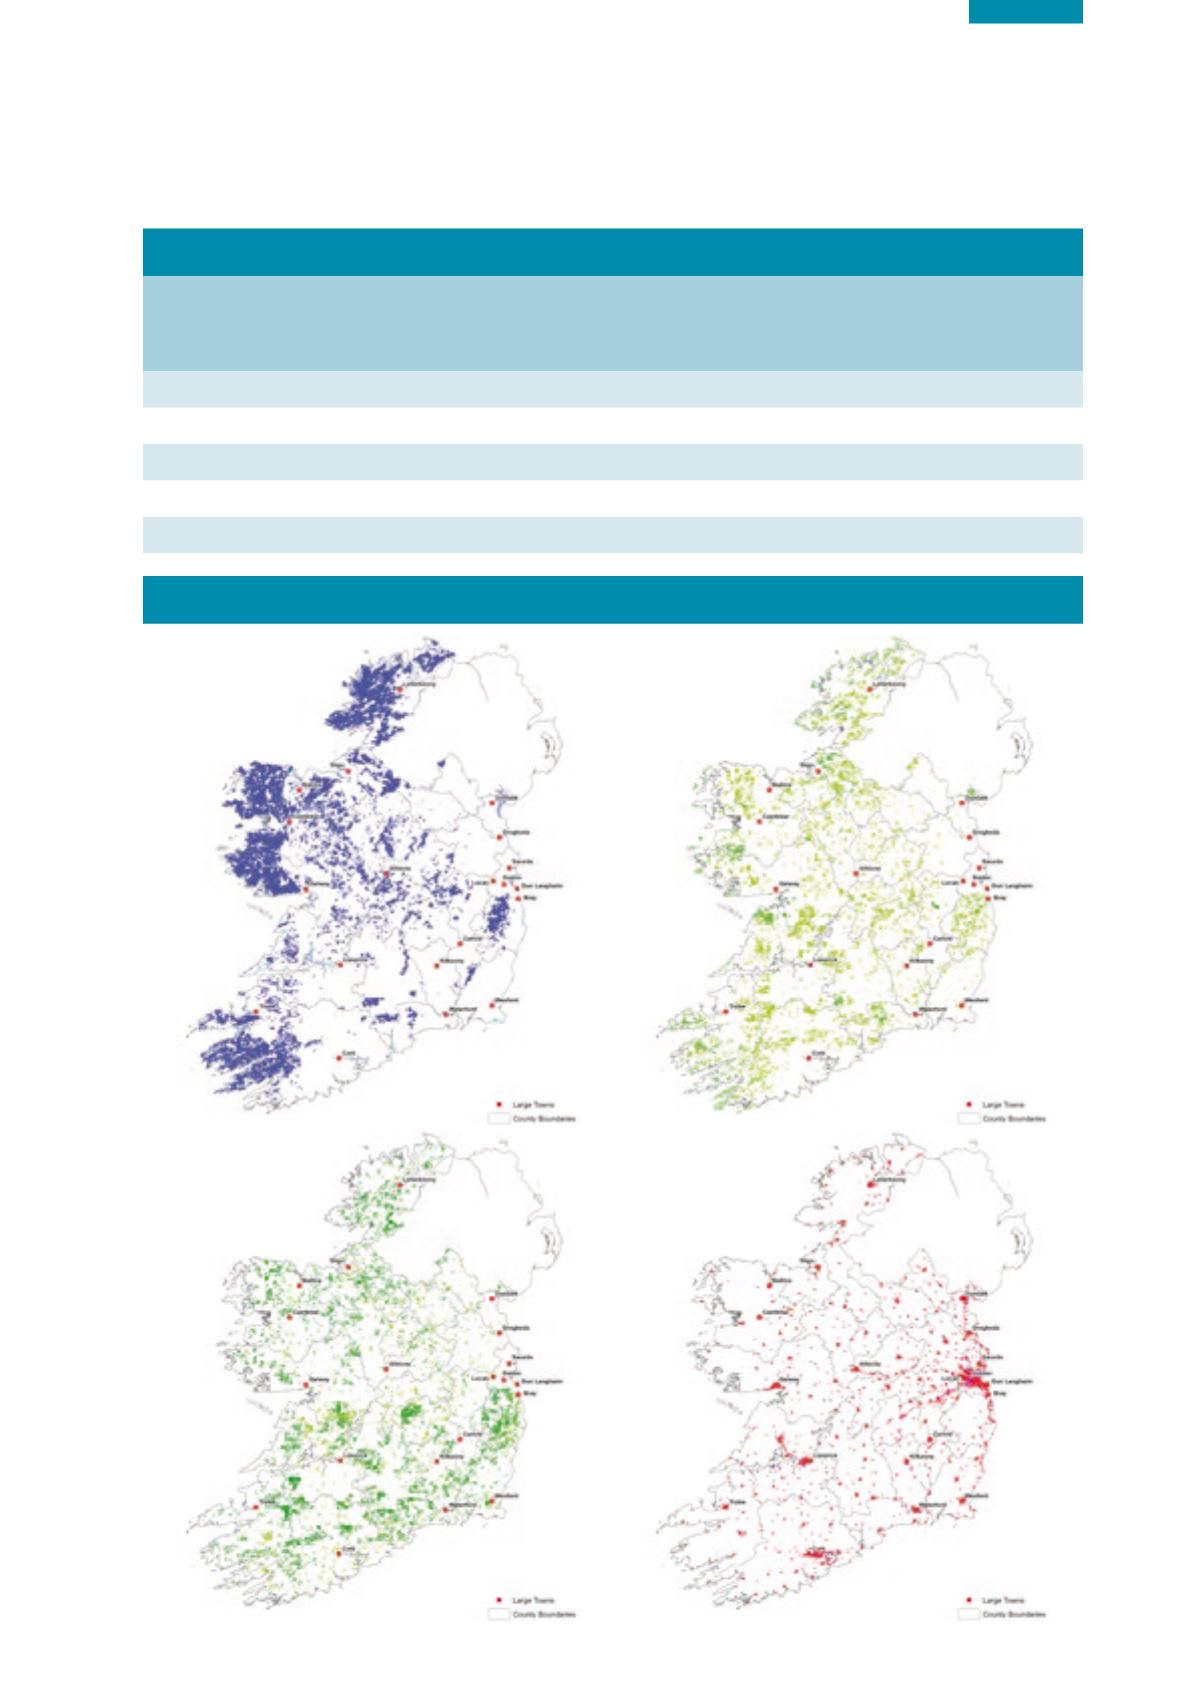
Figure 7.2
CORINE Landcover Maps (Source: EPA GIS stock)
Semi-Natural & Low
Vegetation Areas
Artificial Surfaces
Wetlands
Forestry