
Ireland’s Environment – An Assessment 2016
94
projects), Green Business, Green Hospitality and Green
Healthcare. The latest NWPP plan is
Towards a Resource
Efficient Ireland: A National Strategy to 2020
(EPA, 2014a).
There is also a strong focus on waste prevention in the
current regional Waste Management Plans.
To obtain an indicator for household waste prevention,
household waste generated per person was divided by
the goods-related component of the Central Statistics
Office’s personal consumption of goods and services
indicator (goods include food, drink, transport, household
equipment). This gives estimates for household waste
generated per euro spent on goods and is called “waste
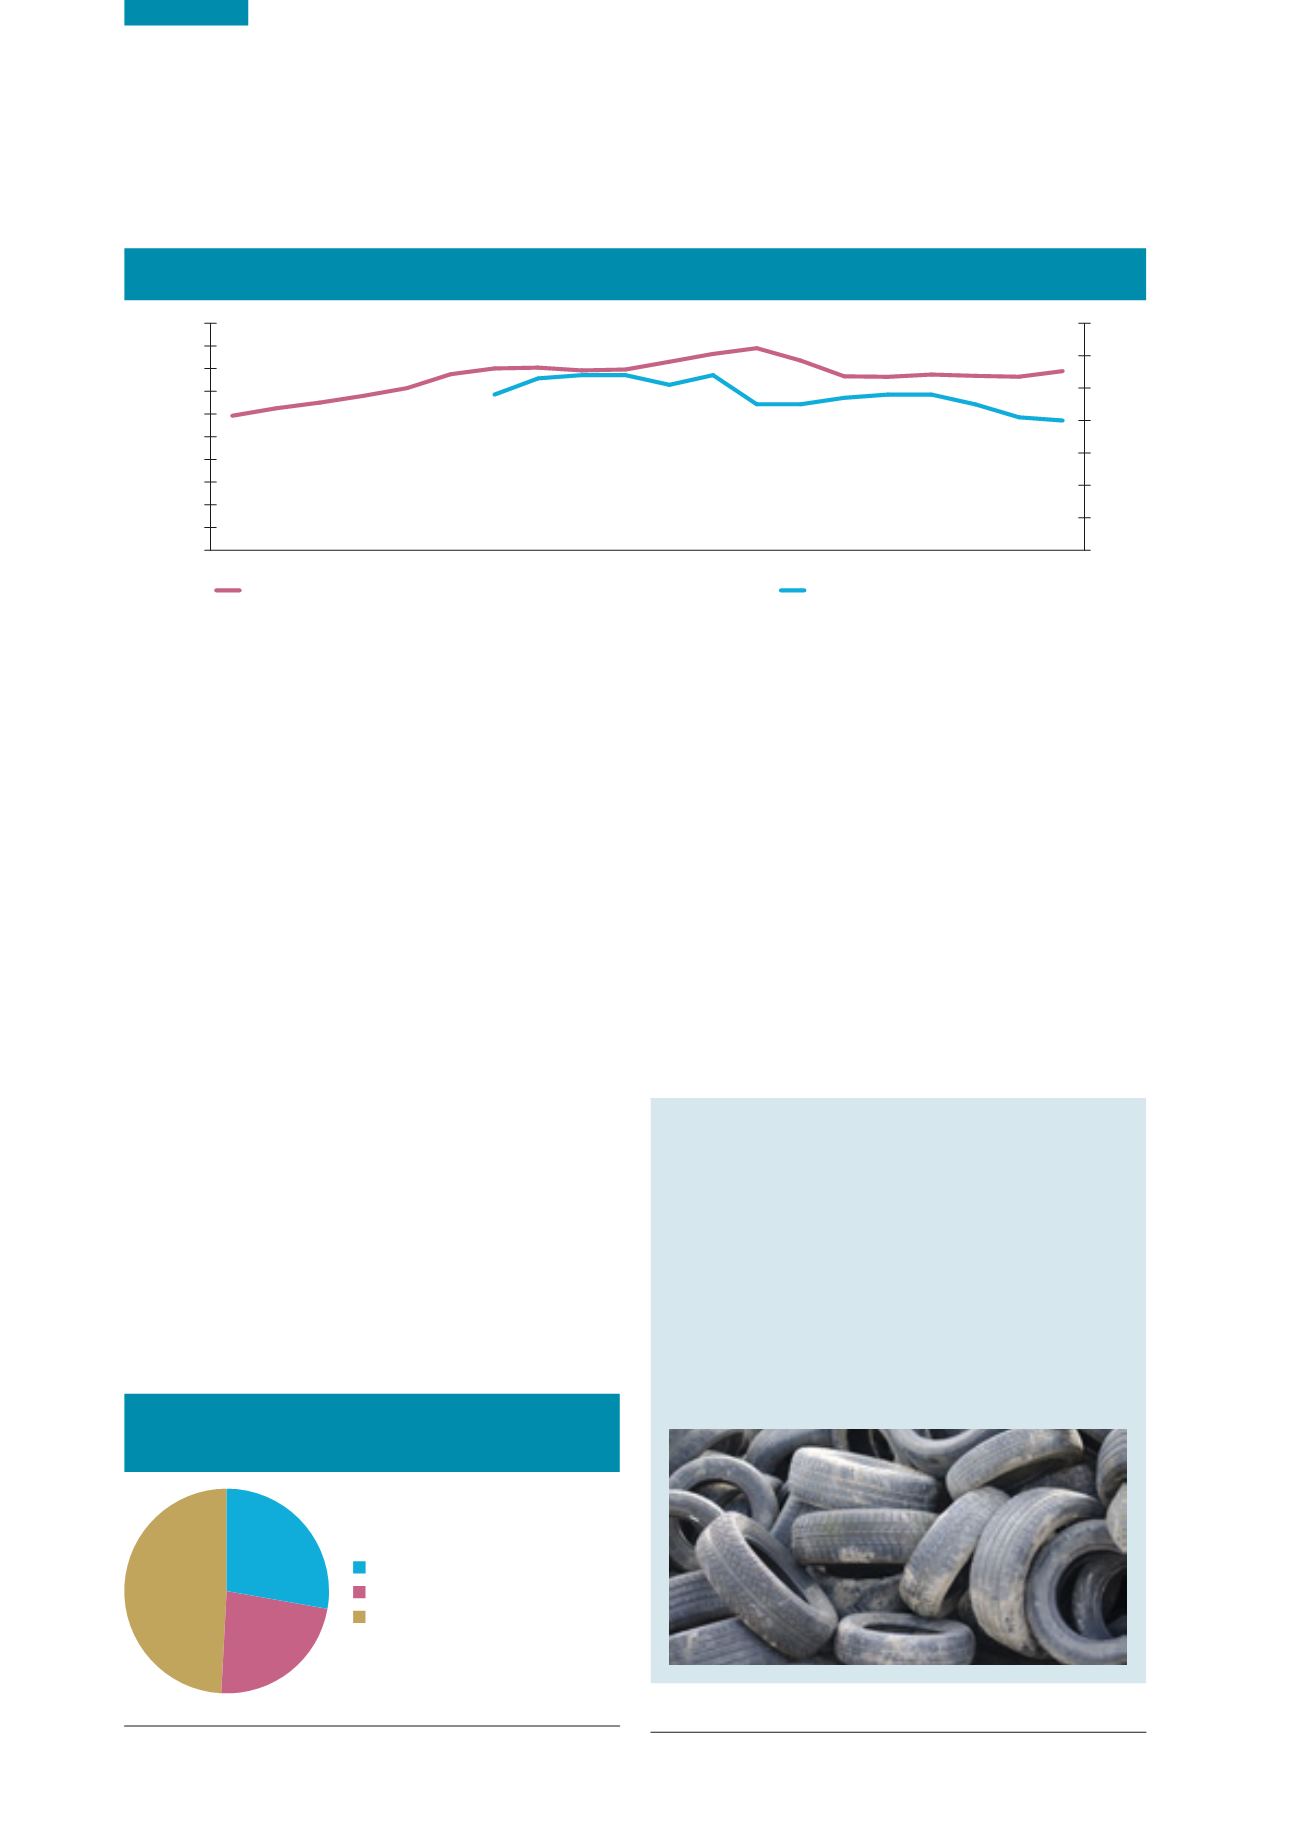
intensity”. There is some evidence of a general decline in
waste intensity of goods between 2004 and 2014 (see
Figure 6.3), which may be due to waste prevention efforts.
Waste Generation
Industrial waste accounts for 80% of national waste
generation.
National waste generation data are compiled every
2 years as required under the Waste Statistics Regulation.
6
Preliminary data indicate that 11.91 Mt of waste was
generated in 2014.
7
Of this total, 23% (2.73 Mt) was
generated by municipal sources, 28% (3.31 Mt) by
construction and demolition sources and 49% (5.87 Mt)
by other sources (e.g. industry, agriculture) (see Figure 6.4).
6 Radioactive waste is excluded from the scope of this reporting obligation.
7 Final 2014 data will be available later in 2016.
Extended Producer Responsibility
The national review of extended producer
responsibility will lead to an expansion in the
schemes in place.
Four waste streams are subject to Extended Producer
Responsibility (EPR) under EU legislation: packaging, end-
of-life vehicles, batteries and accumulators, and WEEE.
In Ireland farm plastics and tyres are also subject to EPR
under national legislation. Under EPR, producers
8
have
obligations regarding the environmental impact of their
products from design to end of life. A review of the EPR
models in Ireland by DECLG recommended changes to the
ELV and tyre systems (DECLG, 2014). DECLG is currently
progressing the review recommendations through
stakeholder working groups.
Tyres/Waste Tyres
The management of waste tyres has been subject to
national regulation since 2007. The existing scheme
is mainly to track tyres/waste tyres, but a review of
the scheme estimated that 24–51% of waste tyres
were unaccounted for (DECLG, 2014). The DECLG has
therefore established a new EPR for the sector, which
will place much greater responsibility on producers
and importers, and include financing of the scheme.
It is anticipated that the revised legislation will be in
place by the end of 2016.
8 The definition of producer varies for different EPRs, but essentially
covers manufacturers and importers of products.
Figure 6.3
Waste Intensity of Goods Consumed by Households, 2001‑2014 (Source: EPA, CSO)
0
1,000
2,000
3,000
4,000
5,000
6,000
7,000
8,000
9,000
10,000
2014
2013
2012
2011
2010
2009
2008
2007
2006
2005
2004
2003
2002
2001
2000
1999
1998
1997
1996
1995
Household waste generated per € goods (g per €)
Personal consumption (mainly goods) (€ per person)
0
10
20
30
40
50
60
70
g per €
€ per person
Figure 6.4
Waste Generation in 2014, Percentage
by Source (Source: EPA, 2016)
Construction and demolition waste
28%
Municipal waste
23%
Other sources
49%


