
Ireland’s Environment – An Assessment 2016
98
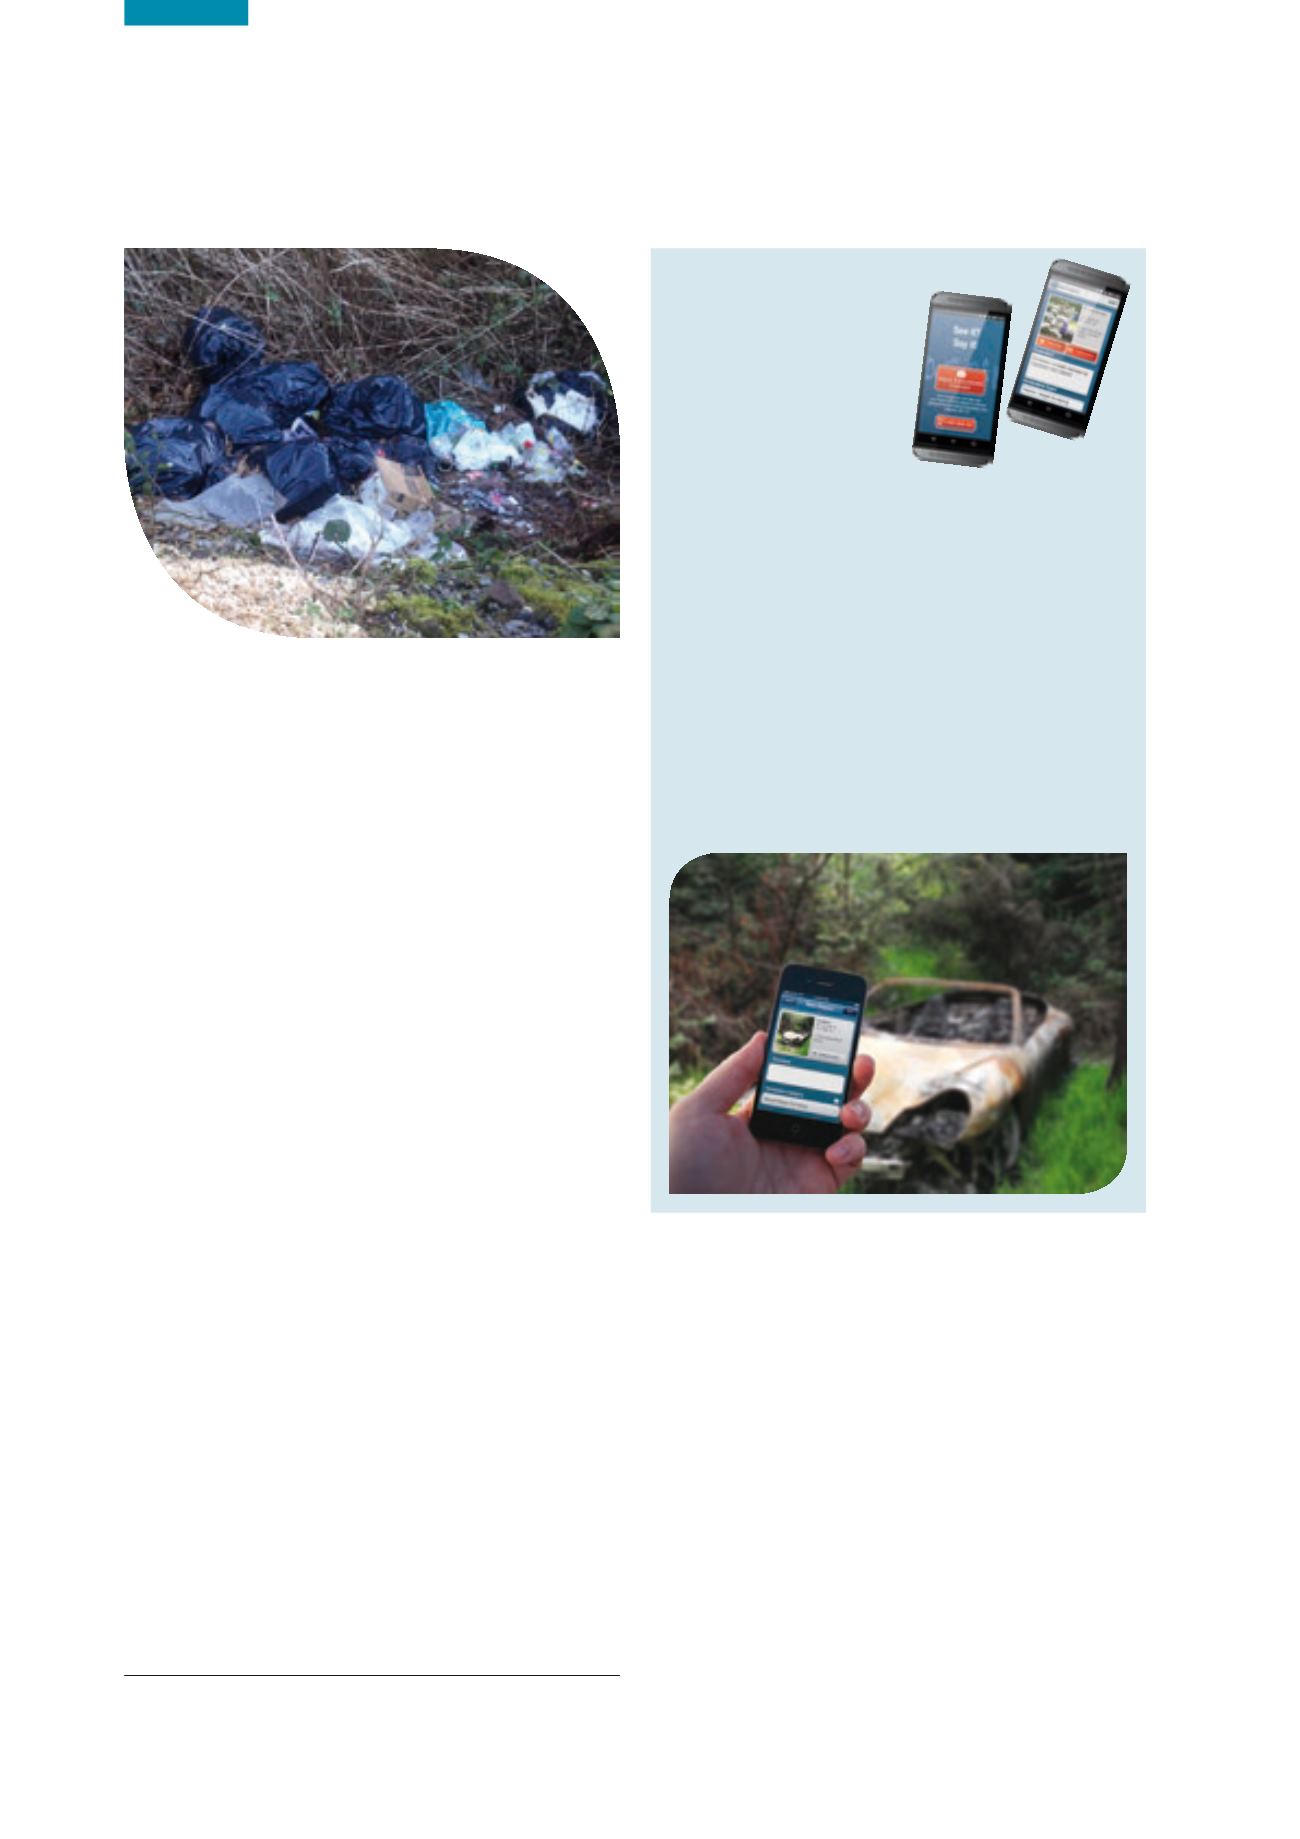
Litter and Fly-tipping
Litter and fly-tipping is still a significant issue
in Ireland.
The presence of litter and fly-tipped waste in the
environment is one of the most visible and undesirable
aspects of waste generation. Local authorities are
responsible for its management and for enforcement.
The best estimate for 2014 is that 70,000 tonnes of waste
from litter and street bins and from street cleansing,
fly-tipped and community clean-up was collected for
management. This is a considerable amount of waste,
which potentially includes recyclable packaging waste and
WEEE. The sociological reasons for littering are complex,
but in the main stem from cost avoidance and poorly
developed citizenship values. The threat of enforcement
and the level of economic sanctions are clearly insufficient
to deter the public.
The National Litter Pollution Monitoring System’s most
recent report (DECLG, 2015b) indicates that the proportion
of areas deemed to be completely unpolluted was 12.3%,
the highest level achieved since monitoring began, while
0.3% of areas were deemed to be grossly polluted.
The main cause of litter pollution is passing pedestrians
(41%). The main constituent elements of litter pollution
are cigarette-related (55%), chewing gum (15%) and
packaging (12%).
Some national anti-litter initiatives, which are examples of
good citizenship, include:
n
National Spring Clean run by An Taisce
13
n
SuperValu Tidy Towns competition
14
n
Irish Business Against Litter (IBAL) National Litter League.
15
13
www.nationalspringclean.org14
www.tidytowns.ie15
www.ibal.ieSee it? Say it!
The EPA’s smartphone app
See it? Say It!
helps people
to report environmental
pollution such as fly-tipping,
littering and backyard
burning.
This app complements the 24-hour nationwide
environmental complaints phone line (1850 365 121).
The complaints are ultimately delivered to the
FixYourStreet.iewebsite
( www.fixyourstreet.ie ), which
is monitored continuously by all local authorities. Local
authorities receive in the region of 50,000 to 60,000
complaints annually in relation to environmental
issues, of which approximately 68% are related to
litter and fly-tipping. In many cases the litter includes
material that can be recycled for free (e.g. WEEE,
batteries). The app can be downloaded by visiting
goo.gl/gOJMa(iPhone App) or
goo.gl/V7eNYe(Android App).
Construction and Demolition Waste
Quantity of construction and demolition waste
generated is a good indicator of economic growth.
The quantity of construction and demolition (C&D) waste
managed is indicative of economic activity. The bulk of
C&D waste is made up of uncontaminated soil and stones,
with the remainder segregated wastes such as rubble,
concrete, bricks, glass, plastic, wood, metals and mixed
C&D waste. At the peak of the boom, approximately
17.8 Mt of C&D waste was collected for treatment. This
dropped to 3 Mt mid-recession. Preliminary data indicate
that 3.31 Mt of C&D waste was generated in 2014. With
a government policy focus on the provision of social
housing, major road infrastructural projects and the new
children’s hospital, C&D waste generated will increase
again in the coming years. We need to ensure that
C&D waste is prevented where possible, and otherwise
managed properly, and that there is adequate treatment
capacity to cope with renewed activity in the sector.


