
Ireland’s Environment – An Assessment 2016
96
biodegradable municipal waste (BMW) disposed to landfill
in 2015 and 2016 (in the same time period the export
for residual waste for recovery decreased). It would be a
retrograde step if the quantity of municipal waste disposed
to landfill were to start to increase again, but with
additional waste to energy capacity coming on-stream in
2017, it is hoped that the 2015‑2016 trend will be short
term, the result, perhaps, of a lack of export markets, or
cost driven. While preliminary data indicate that the July
2016 Landfill Directive target for BMW disposal to landfill
has been met, there is a risk that increased generation of
municipal waste, or lack of waste to energy capacity, will
increase the BMW disposal tonnage in future.
10 2016 pro-rata based on Q1 and Q2 2016 data.
Many industries treat the waste they generate on-site,
under licence issued by the EPA. Types of activity are
incineration (e.g. waste solvents) and landfilling (mining/
mineral waste landfills).
Segregated metal, glass, plastic, paper and cardboard
wastes are in the main exported for recycling owing
to a lack of national infrastructure. The regional Waste
Management Plans reported an overcapacity for
pretreatment activities (storage, sorting, bulking, transfer
of waste). Table 6.2 presents information on key waste
infrastructure capacity.
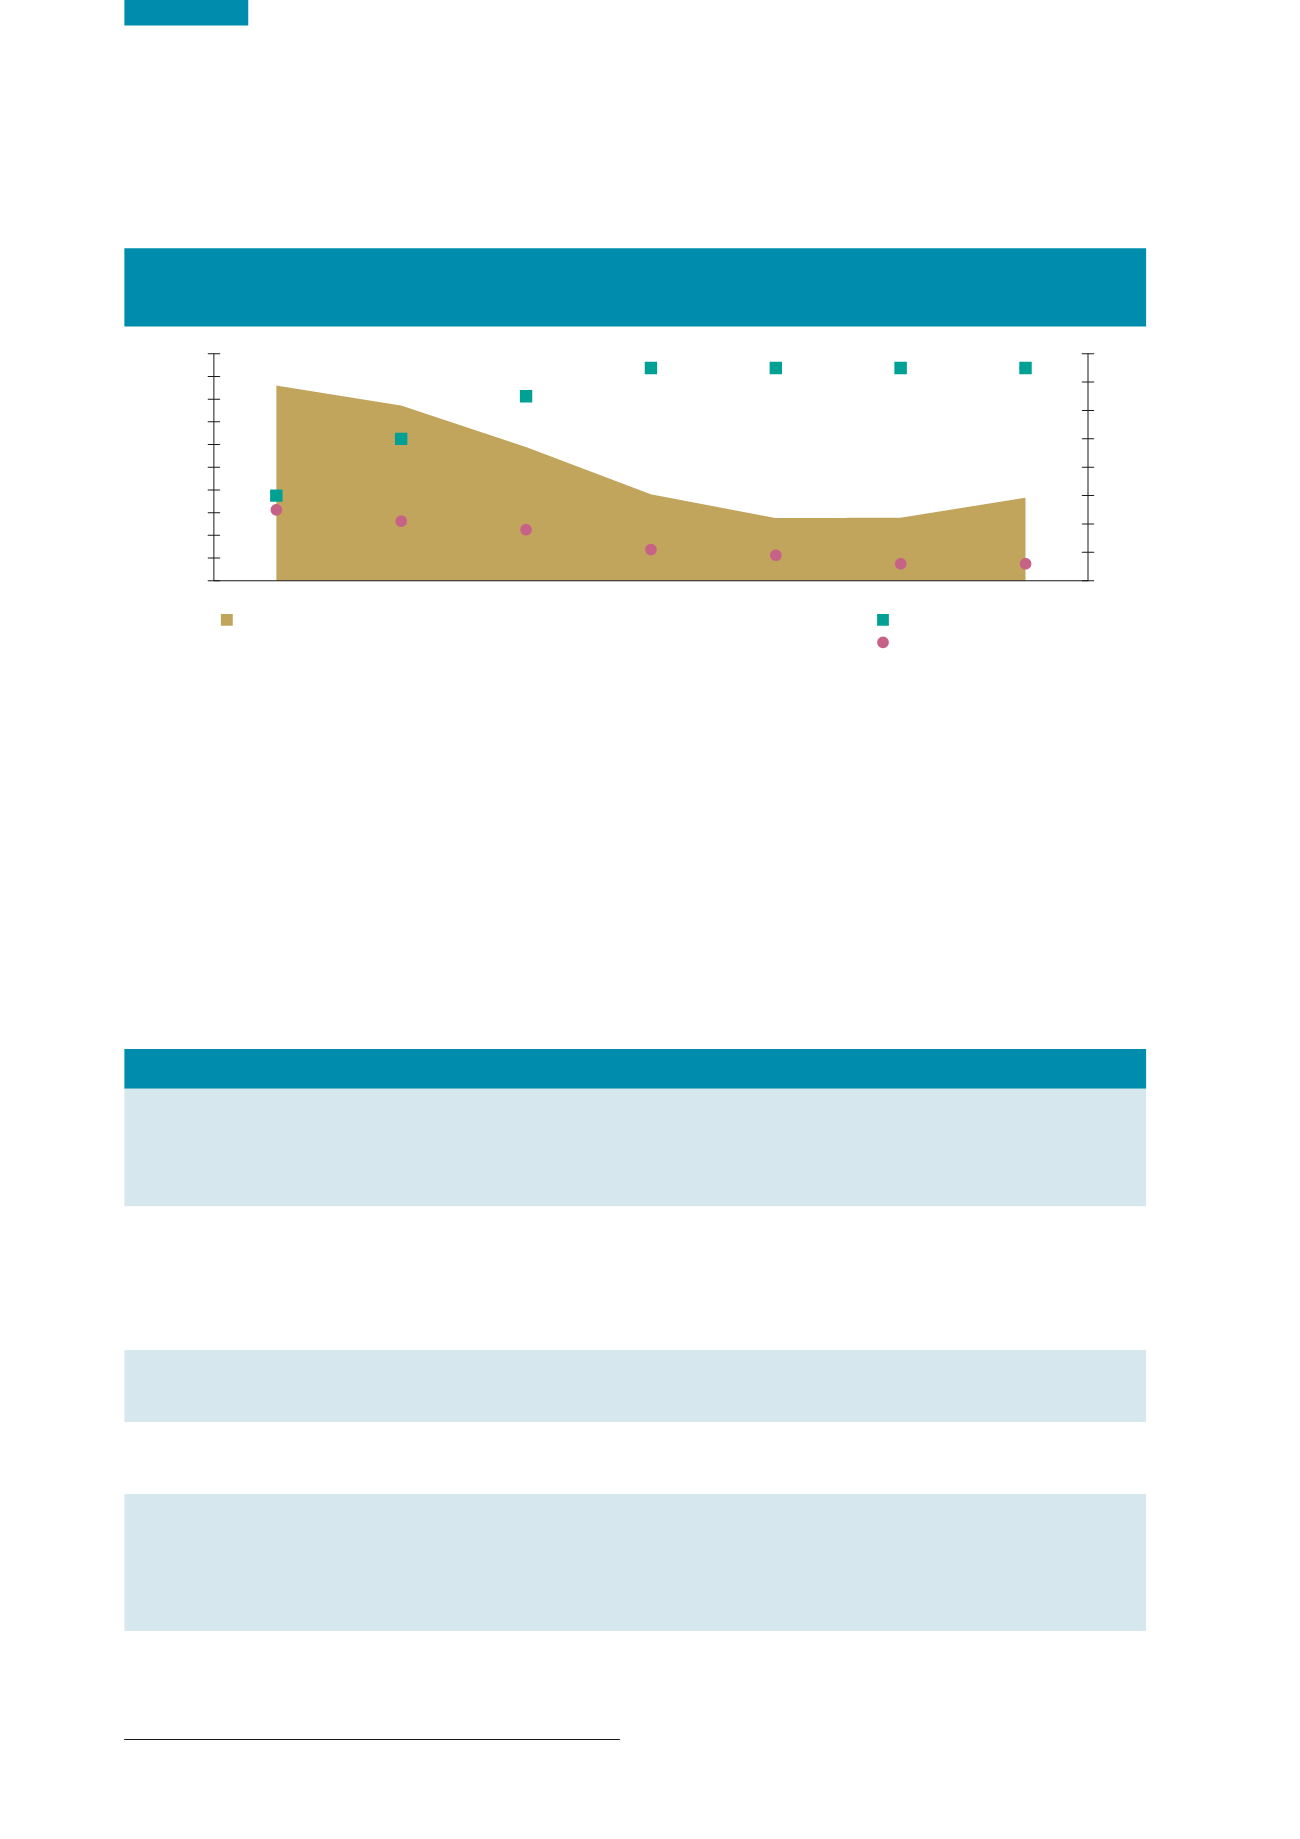
Figure 6.6
BMW Disposed to Landfill (tonnes), Landfill Levy (€ per tonne) and Number of Active Landfills
2010‑2016
10
(Source: EPA)
0
100,000
200,000
300,000
400,000
500,000
600,000
700,000
800,000
900,000
1,000,000
2016 (pro-rata)
2015
2014
2013
2012
2011
2010
BMW disposed to landfill (tonnes)
Tonnes
Landfill levy (€ per tonne)
Number of active municipal landfills
0
10
20
30
40
50
60
70
80
Number/€ per tonne
€75
€75
€75
€75
€65
€50
€30
6
6
9
11
18
21
25
Table 6.2
Waste Infrastructure Capacities in Ireland (Source: EPA)
Landfill
Built municipal waste landfill
capacity
910,000 tonnes built capacity at end of 2014
Hazardous waste landfill
Zero
Incineration
Municipal waste to energy
incineration
230,000 tonnes per annum active
600,000 tonnes per annum under construction
Co-incineration of solid
recovered fuel at cement kilns
343,000 tonnes per annum
Biological treatment
Composting and anaerobic
digestion
Approx. 540,000 tonnes per annum (65,000
tonnes of which is anaerobic digestion)
Commercial hazardous
waste treatment
Approx. 380,000 tonnes*
Public amenity facilities
** Civic amenity sites
130 (94 public sector, 36 private sector)
Bring banks
1,787 (1,772 public sector, 15 private sector)
Pay-to-use compactors
Approx. 50 (private sector)
*Physical and chemical treatment. Not including incineration and co-incineration plants which are authorised to accept certain hazardous materials for treatment.
**2014 data


