


 50 / 234

Ireland’s Environment – An Assessment 2016
46
Emissions Projections
Projections suggest that Ireland will not meet its
emissions reduction targets.
The EU 2020 target is based on a combination of annual
targets from 2013 to 2020 to give an overall reduction by
2020. Official projections of GHG emissions to 2020 are
provided annually by the EPA based on two scenarios: (1)
with current policies, regulations and incentives (i.e. With
Measures, WM) and (2) with additional policies, regulations
and incentives (i.e. With Additional Measures, WAM).
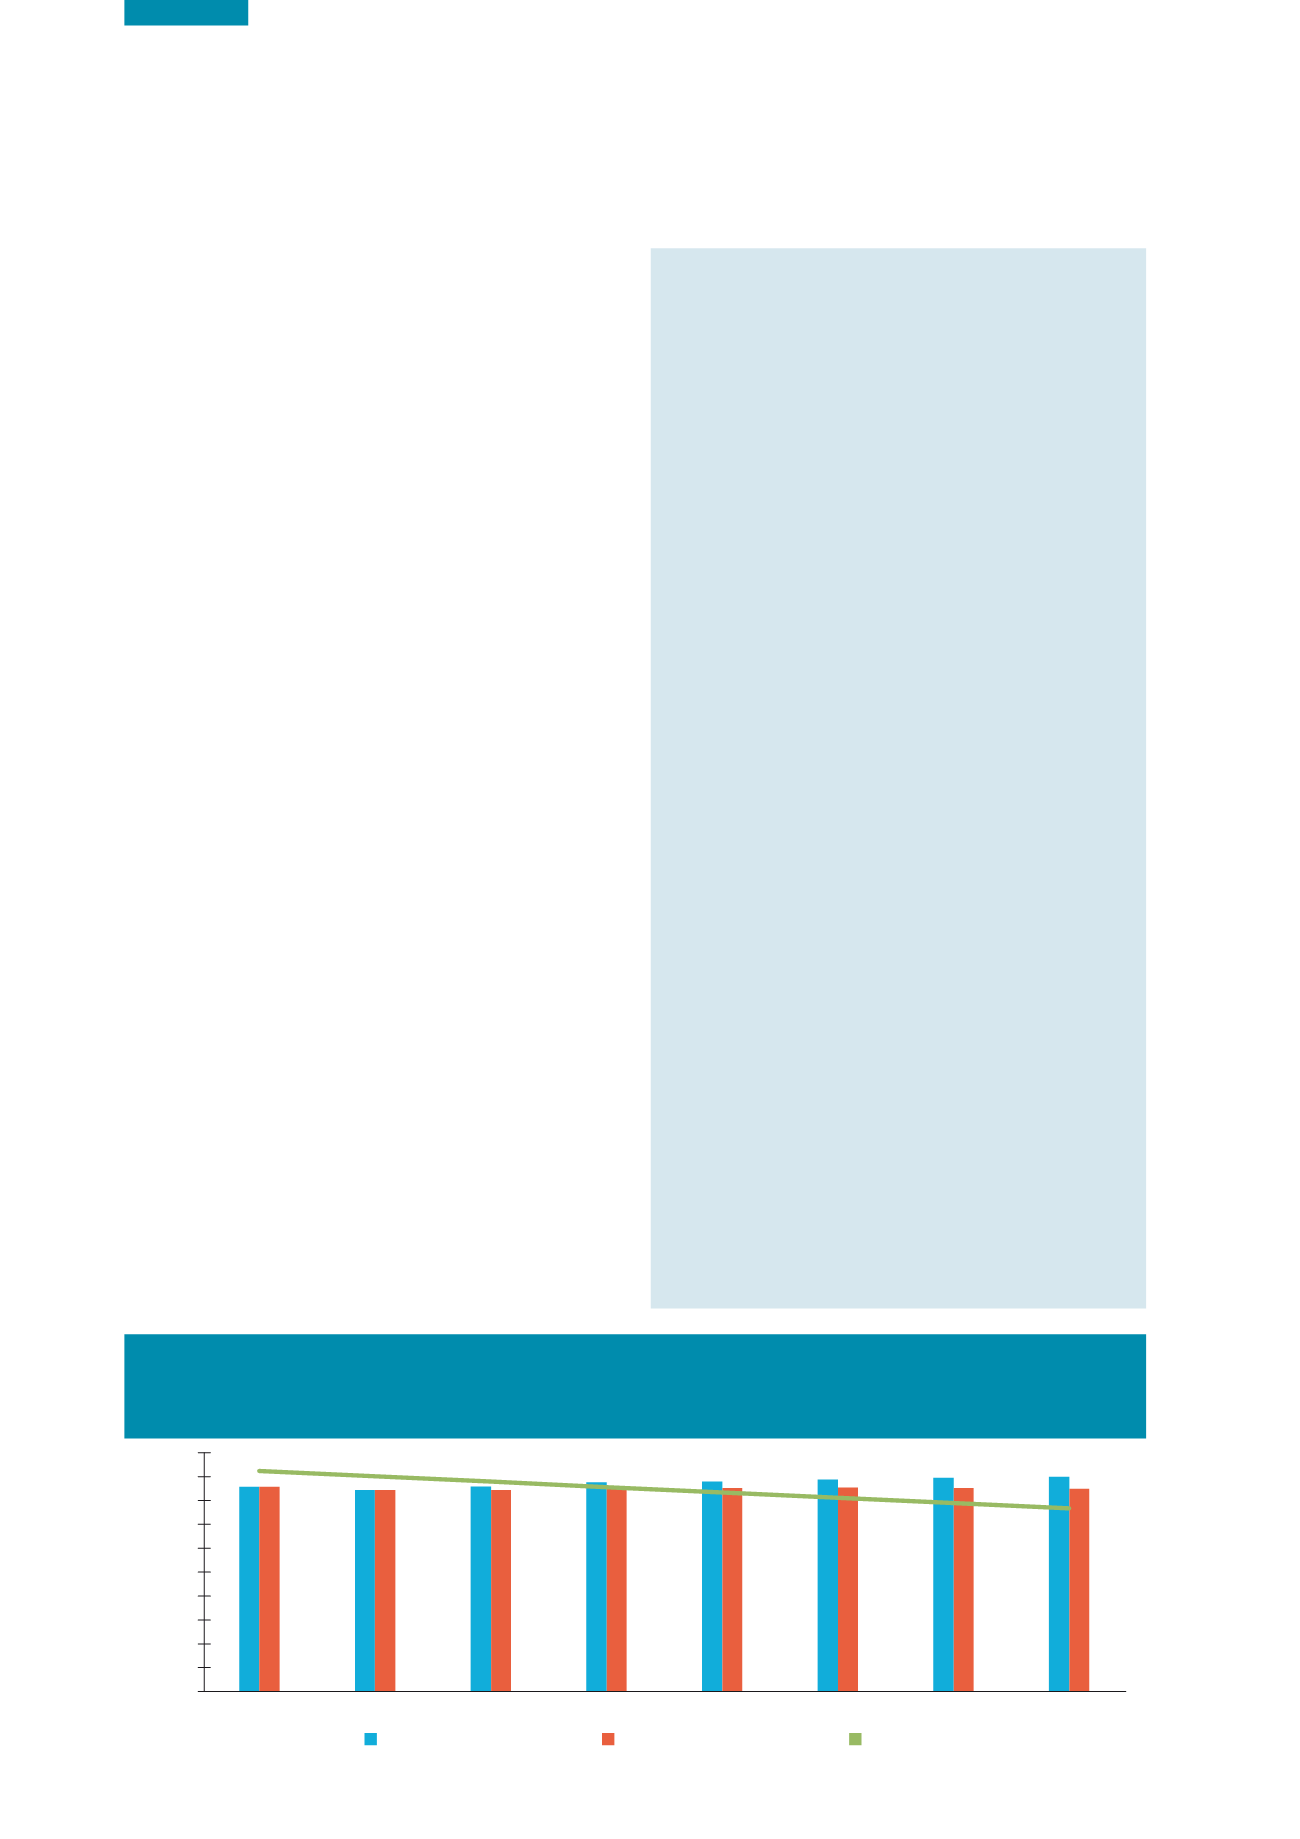
These are depicted separately as blue and red bars in Figure
3.7. This shows that based on current policies, Ireland is
projected to exceed its annual limits in 2016 and, even with
additional polices, this limit would be exceeded in 2017.
For the period 2014‑2020, agriculture emissions are projected
to increase by 6–7%. Transport emissions are projected to
show strong growth over the period to 2020, with a 10–16%
increase on 2014 levels. Based on the two emissions scenarios
described above, total emissions are projected to be 6%
(scenario 1) or 11% (scenario 2) below 2005 levels in 2020
(i.e. WM and WAM). The target is a 20% reduction.
These projections are therefore a cause for significant concern
in the context of the anticipated requirements for further
reductions in GHG emissions in the period 2021‑2030. Failure
to meet the 2020 target would make future compliance
challenges more difficult and costly. In addition, the analysis
suggests that Ireland is not on track for, or projected to be
moving in the right direction, to meet its National Policy
Position, which aims to achieve a least 80% reductions in
carbon dioxide emissions by 2050 relative to 1990 levels and
achieving neutrality in the agriculture and land use sectors.
Further polices, regulations and incentives are therefore
urgently needed to meet existing targets and to move to
a pathway to achieve the 2050 transformation objective.
Increased strategic planning, investment and resources are
also needed to achieve this in the overall framework of EU
and global commitments.
Land Use, Land Use Change and
Forestry
Land management has a key role in the national, EU
and global response to climate change. The Kyoto
Protocol established a complex set of rules for reporting
and accounting for emissions and removals resulting
from land use and land use change. Ireland has
significant and healthy biosystems, including grassland,
hedgerows and forests, which sequester carbon
dioxide. Mineral soils and peat make up a large portion
of Ireland’s land areas and have high carbon content.
Under the Kyoto Protocol, Ireland currently accounts
for GHG emissions and removals associated with
forest land, cropland and grazing land. Peatlands and
wetlands are not yet included but constitute a major
area of carbon-rich land that needs to be protected.
Since 1990, Ireland’s forest area has expanded by
approximately 260,000 ha. As these forests grow
and mature, they will represent an important carbon
dioxide sink and long-term carbon store in biomass
and soil. The current national forestry policy addresses
these strategic advantages (DAFM, 2014).
In general, well-managed grasslands on mineral soils
tend to take up and store carbon in the soil. However,
changes from grassland to arable land, in particular,
can lead to significant carbon dioxide emissions as a
result of the disturbance of the soil and the loss of
vegetation above ground. Low-impact management
practices can mitigate such effects without
significantly reducing productivity.
The management of peatlands is a particular concern
with respect to potential for loss of carbon. Peat
extraction and change of use of drained peatland to
grassland or forestry leads to high rates of carbon loss.
In general, land management should aim to preserve
or enhance areas that have active carbon uptake
in soils and biomass, and reduce or eliminate areas
that are a source of carbon emissions. Such altered
practices also yield benefits for ecosystem services.
Figure 3.7
Greenhouse Gas Emission Projections Assuming Continuing with Existing Measures (blue bars)
and Implementation of Additional Measures (red bars) and Comparison with the Linear Reduction Pathway
Required Between 2013 and 2020 (Source: EPA, 2016b)
WAM Non-ETS Emissions
Annual Limits
WM Non-ETS Emissions
Mt CO
2
eq
0
5
10
15
20
25
30
35
40
45
50
2013
2014
2015
2016
2017
2018
2019
2020