


 48 / 234

Ireland’s Environment – An Assessment 2016
44
In addition to the national mitigation plan, there will be
development of sectoral plans (e.g. transport, agriculture)
and Local Authority plans.
The first National Mitigation Plan and the National
Adaptation Framework must be submitted to Government
by June and December 2017, respectively. The Minister
for Communications, Climate Action and Environment
10
together with other relevant ministers (e.g. for transport,
heritage and agriculture) will present annual transition
statements to the Oireachtas on progress relating to
climate mitigation and adaptation.
The Climate Change Advisory Council
11
was established by
ministerial order under the 2015 Act to provide advice and
recommendations to ministers and the Government on
national responses to climate change. The Council is made
up of seven members appointed by the Government and
four
ex officio
members, who represent the Environmental
Protection Agency, the Sustainable Energy Authority of
Ireland, the Economic and Social Research Institute and
Teagasc. The primary function of the Council is to evaluate
and report on national progress in relation to mitigation
and adaptation planning and implementation, as well as
progress on international obligations.
10 Refer footnote 1.
11
www.climatecouncil.ieIreland’s Greenhouse Gas
Emissions
Greenhouse gas emissions have peaked but greater
reductions are needed.
Ireland’s GHG emissions peaked in 2001 at 71,394 kt
CO
2
equivalent. In 2014, total emissions of GHGs,
including indirect emissions from solvent use, amounted
to 58,254 kt CO
2
equivalent, which is 18% lower than the
peak value but still higher than 1990 emissions (non ETS
base year for limits is 2005).
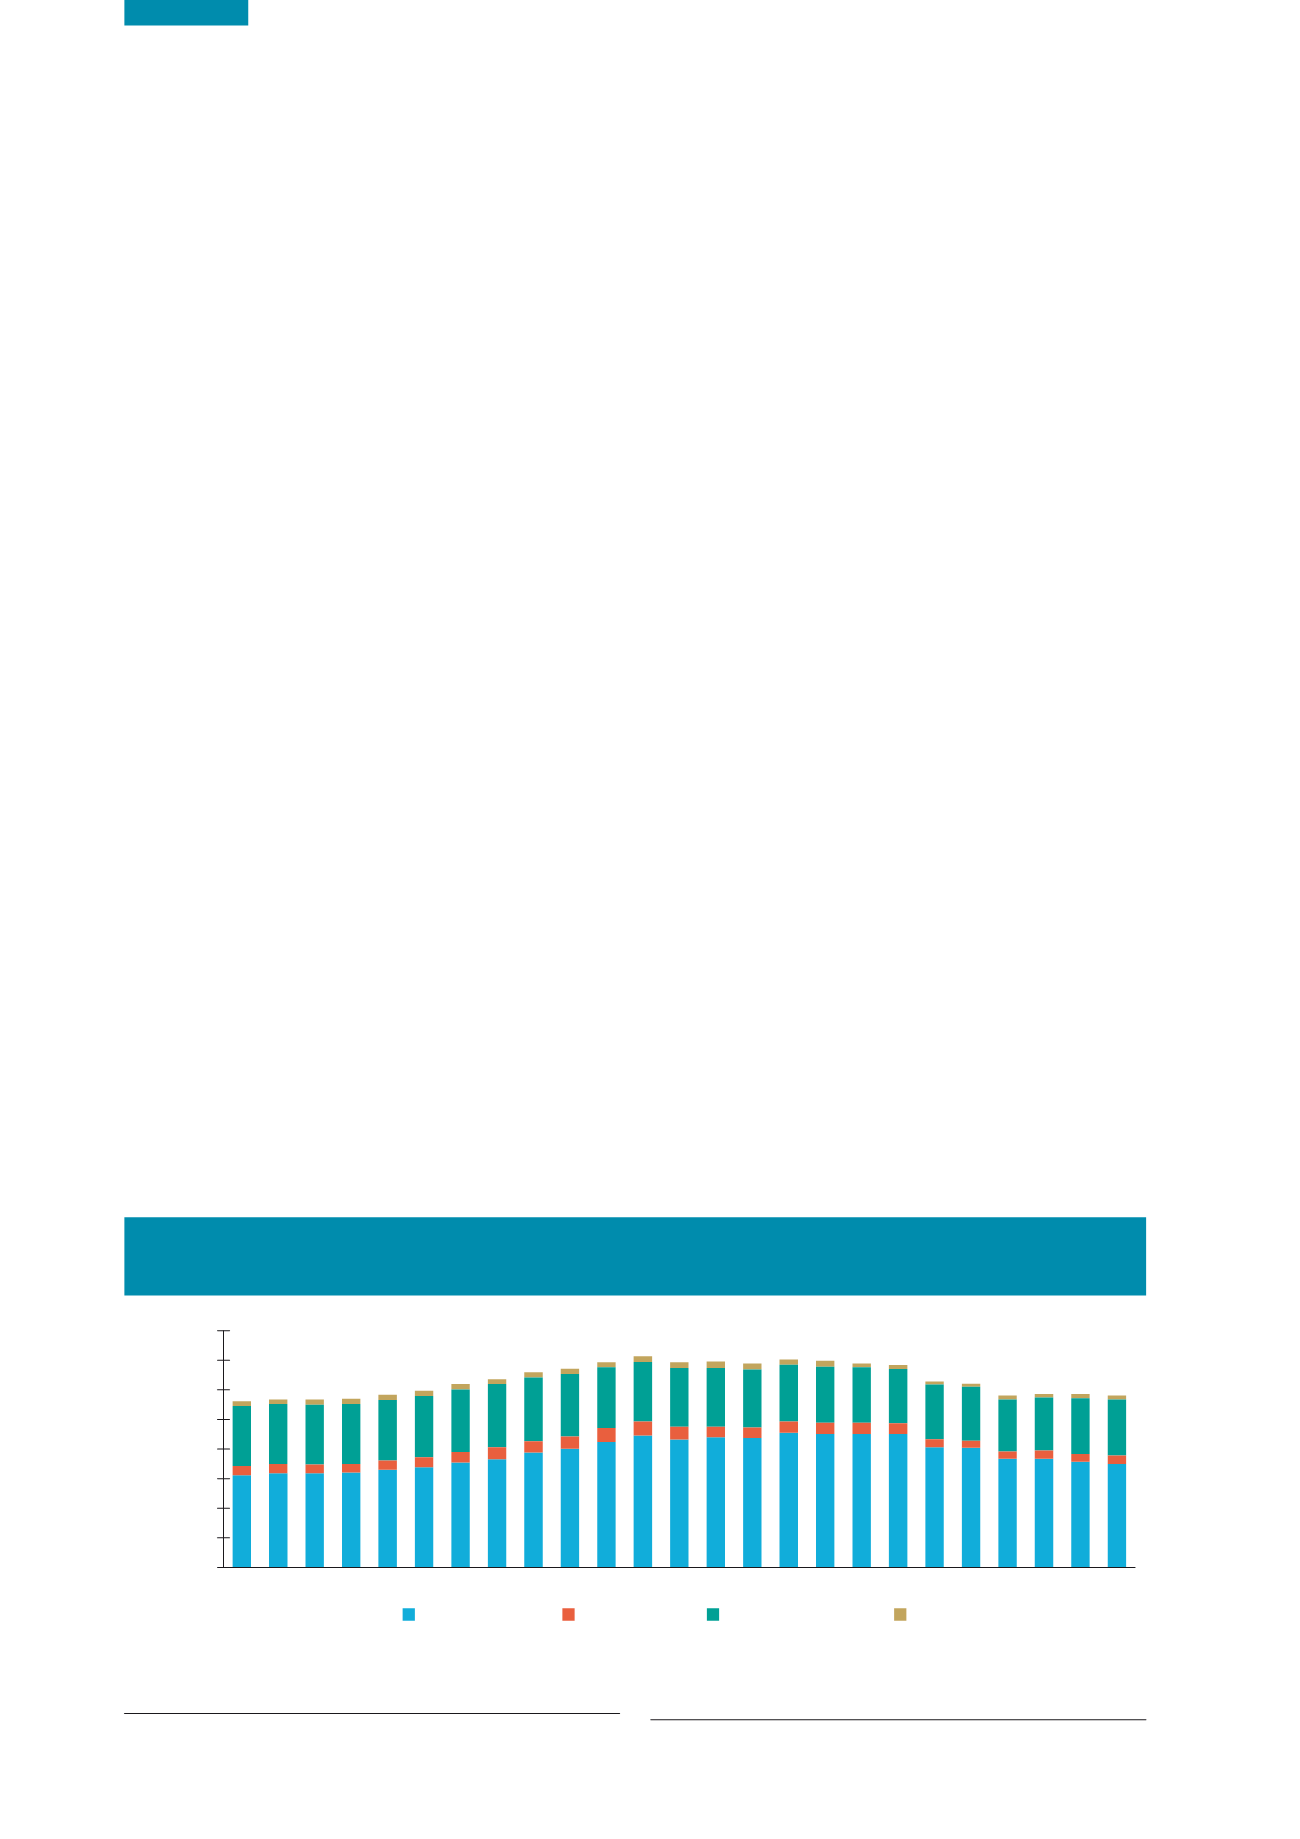
In 2014, the energy sector accounted for 60.1% of total
emissions, agriculture for 32.2%, industrial processes
and product use for 5.2% and the waste sector for
2.6% (based on the UN IPCC sectoral classification, see
Figure 3.3). Carbon dioxide (CO
2
) accounted for 62.9%
of the total, with methane (CH
4
) and nitrous oxide (N
2
O)
contributing 23.1% and 12.0% as CO
2
equivalent,
respectively. The combined emissions of HFC, PFC, SF
6
and
NF
3
accounted for 2.1% of the emissions
12
. Figure 3.4
shows the GHG emissions trend by sector and gas.
Fossil fuel combustion is the principal source of emissions
and these are addressed in Chapters 10 and 11. The
emissions from the agriculture sector, the other main
source category, increased during the 1990s but decreased
to 6.8% below 1990 levels in 2014.
In 2015, total emissions covered under the EU ETS were
16.83 Mt CO
2
equivalent, which is a 25% reduction on
2005 levels. This is, in part, due to the economic crisis, which
had a strong impact on construction (especially cement
manufacture). However, the increasing uptake of renewable
energy in power generation also played an important role.
12 For an introduction to the greenhouses gases see:
www.epa.ie/media/ GHG%20Infographic%202016.pdfFigure 3.3
National Total Greenhouse Gas Emissions by Sector (Excluding Land Use, Land Use Change and Forestry)
1990‑2014 (Source: EPA, 2016a)
0
10,000
20,000
30,000
40,000
50,000
60,000
70,000
80,000
Waste
Agriculture
IPPU
Energy
2014
2013
2012
2011
2010
2009
2008
2007
2006
2005
2004
2003
2002
2001
2000
1999
1998
1997
1996
1995
1994
1993
1992
1991
1990
kilotonnes CO
2
eq