


 49 / 234

45
Chapter 3: Climate Change
Per Capita Emissions in Ireland and EU Emissions
Ireland’s current greenhouse gas emissions amount to 12.6t CO
2
equivalent per person, 63% (7.9t CO
2
per person)
of which emissions come from CO
2
. Per capita CO
2
emissions rose to a peak of 12.4t CO
2
per person in 2001 (66%
of total GHG per capita emissions), following which, apart from very slight increases in 2005 and 2012, it decreased
by 2.8% per annum to the current level of 7.9t CO
2
per person (Figure 3.5).
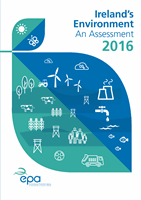
Figure 3.4
Greenhouse Gas Emissions by Gas 1990‑2014 (Source: EPA, 2016a)
0
10,000
20,000
30,000
40,000
50,000
60,000
70,000
80,000
HFC, PFC, SF
6
, NF
3
N
2
O
CH
4
CO
2
2014
2013
2012
2011
2010
2009
2008
2007
2006
2005
2004
2003
2002
2001
2000
1999
1998
1997
1996
1995
1994
1993
1992
1991
1990
kilotonnes CO
2
eq
26.5%
58.5%
23.1%
62.9%
15.0%
12.0%
0.1%
2.1%
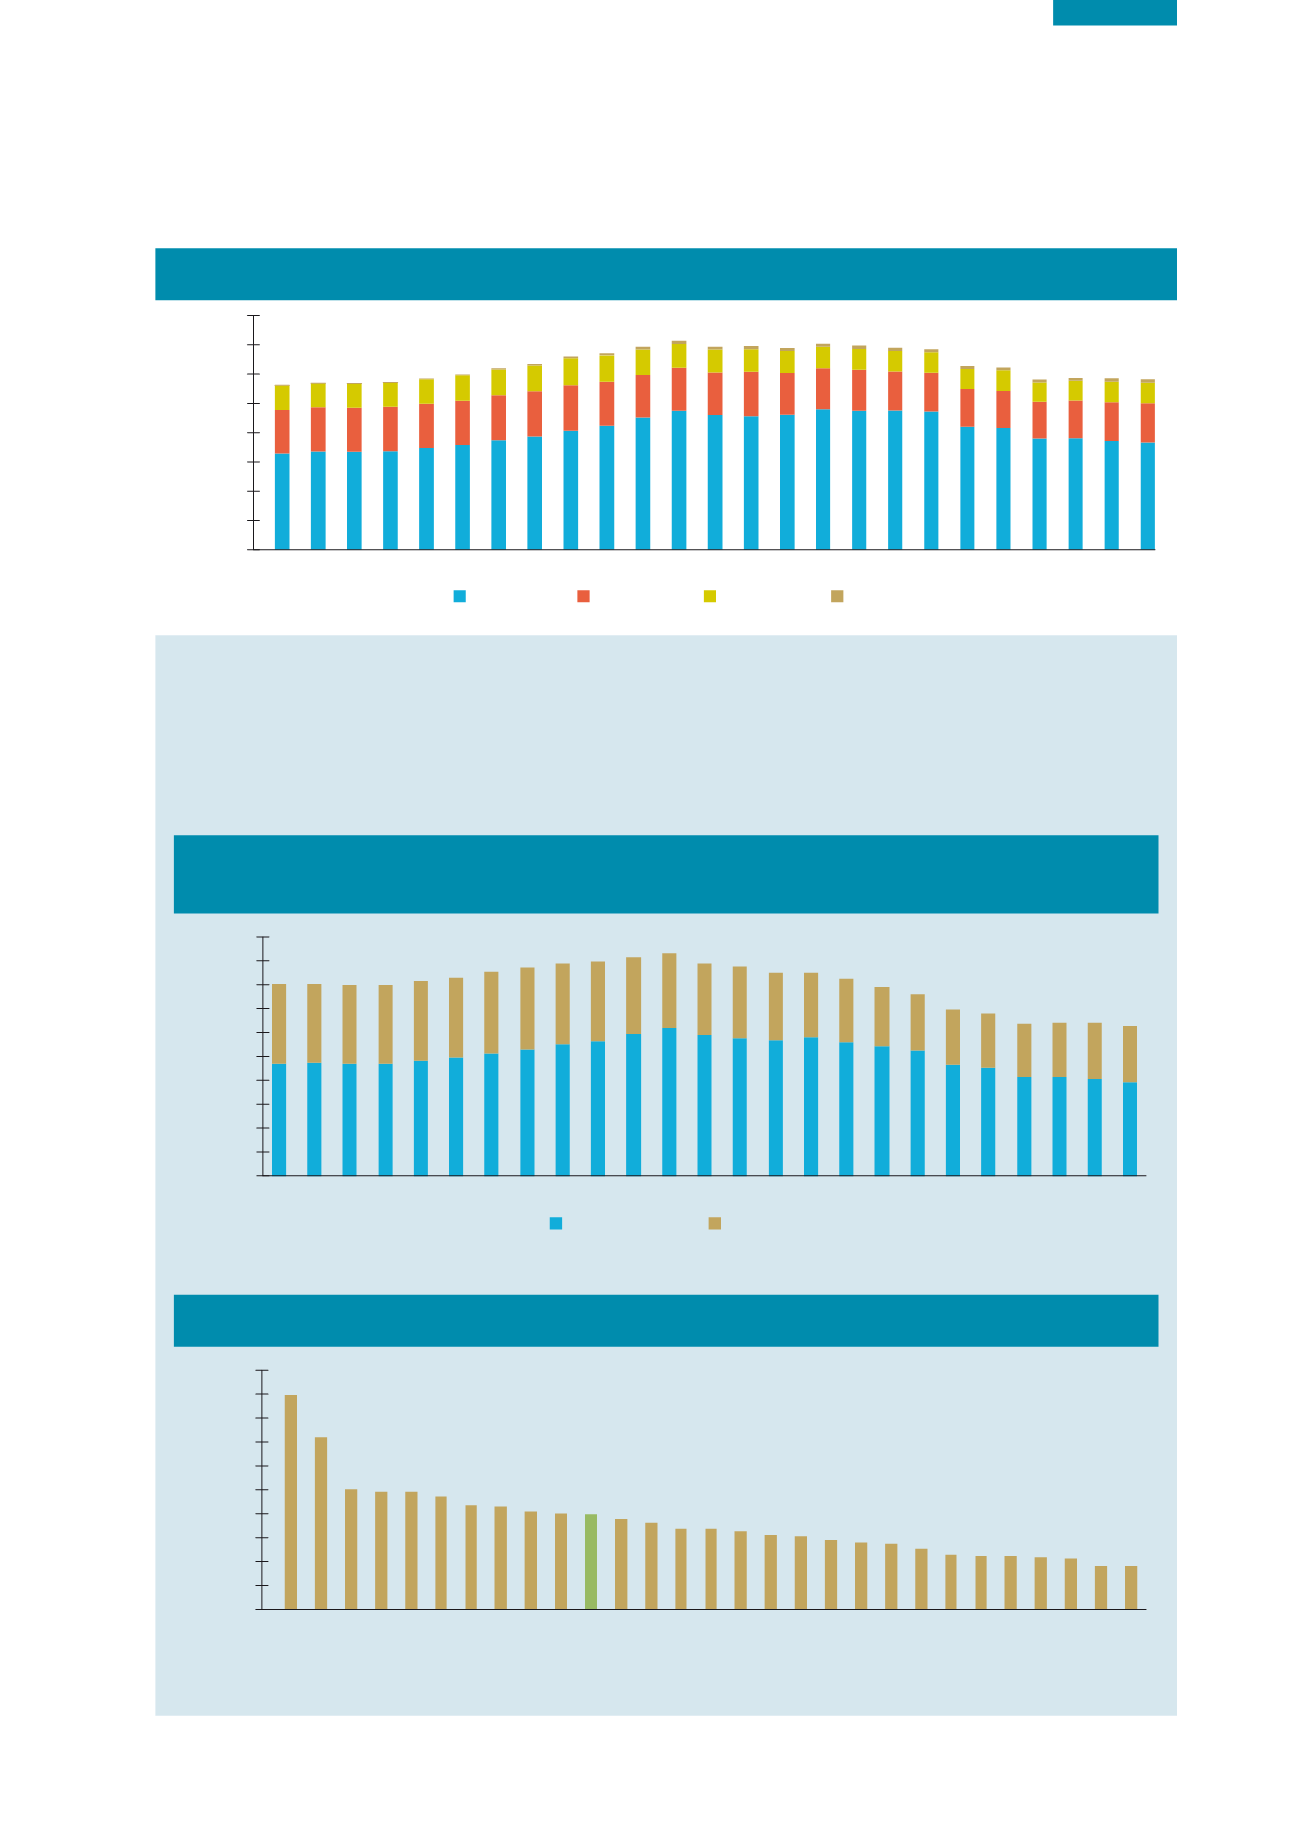
Figure 3.5
Emissions of Greenhouse Gases (t CO
2
equivalent per capita) in Ireland from 1990 to 2014
and Showing Carbon Dioxide Emissions as a Proportion of the Total (Source: EPA, 2016a)
9.4 9.5 9.4 9.4 9.7 9.9 10.3 10.6 11.0 11.3 11.9 12.4 11.8 11.5 11.4 11.6 11.2 10.9 10.5 9.3 9.1 8.3 8.3 8.1 7.9
6.7 6.6 6.6 6.6 6.6 6.7 6.8 6.8 6.8 6.6 6.4 6.2
6.0 6.0 5.6 5.4 5.3 4.9 4.7
4.6 4.5
4.4 4.5 4.7 4.7
t other GHG/capita
t CO
2
/capita
2013 2014
2012
2011
2010
2009
2008
2007
2006
2005
2004
2003
2002
2001
2000
1999
1998
1997
1996
1995
1994
1993
1992
1991
1990
0
2
4
6
8
10
12
14
16
18
20
GHG emissions
(t CO
2
eq per person)
Figure 3.6
Emissions of Greenhouse Gases (t CO
2
per person) in the EU 2014 (Source: EEA, 2016)
17.9
14.4
10.0 9.8 9.8 9.4 8.7 8.6 8.2 8.0 8.0 7.6 7.3 6.8 6.7 6.5 6.2 6.2 5.8 5.6 5.4 5.1 4.5 4.5 4.4 4.3 4.3 3.7 3.6
Luxembourg
Estonia
Iceland
Czech Republic
Germany
Netherlands
Finland
Belgium
Poland
Cyprus
Ireland
Austria
Greece
United Kingdom
Denmark
Slovenia
Bulgaria
Slovakia
Malta
Italy
Spain
France
Portugal
Sweden
Hungary
Lithuania
Croatia
Romania
Latvia
0
2
4
6
8
10
12
14
16
18
20
GHG emissions
(tonnes CO
2
per capita 2014)