


 195 / 234

191
Chapter 12: Environment and Agriculture
and managed. A Food Wise Implementation Plan has been
published along with the strategy (DAFM, 2016b) and will
be a key mechanism for ensuring that relevant evidence
is gathered during implementation to inform decisions on
achieving and maintaining a sustainable agriculture sector.
In addition, a Food Wise 2025 Environmental Sustainability
Committee was established in 2016 to evaluate and assess
the delivery of environmental sustainability and mitigation
actions in the Food Wise Implementation Plan. These
developing implementation structures are welcome.
The vulnerability of the water environment and biodiversity
to adverse impacts of agriculture depends on local and
regional ecosystem capacity to deal with the various
pressures. As such, from an environmental perspective,
some areas are more suitable than others for intensification
(i.e. intensification may be possible without compromising
the quality of the environment) while more vulnerable
areas will need more careful protection. Regional and local
variations in soils, weather and biodiversity in addition
to environmental commitments will place significant
constraints on the achievement of the projections identified
in Food Wise 2025 but which if managed correctly can
create a sustainable path for Irish agriculture into the future.
Current Trends
Agriculture places a series of pressures on the natural
environment.
These environmental pressures include changes to land
use, emissions of nutrients and losses of pesticides from
soils to waters, changes to biodiversity impacting flora and
fauna and their habitats, and emissions of greenhouse
gases (GHGs) and air pollutants such as ammonia. These
pressures include those which impact directly on the local
environment such as the water environment and habitats
and those which impact on the wider scale including
transboundary air pollutants and GHGs.
Greenhouse Gases and Agriculture
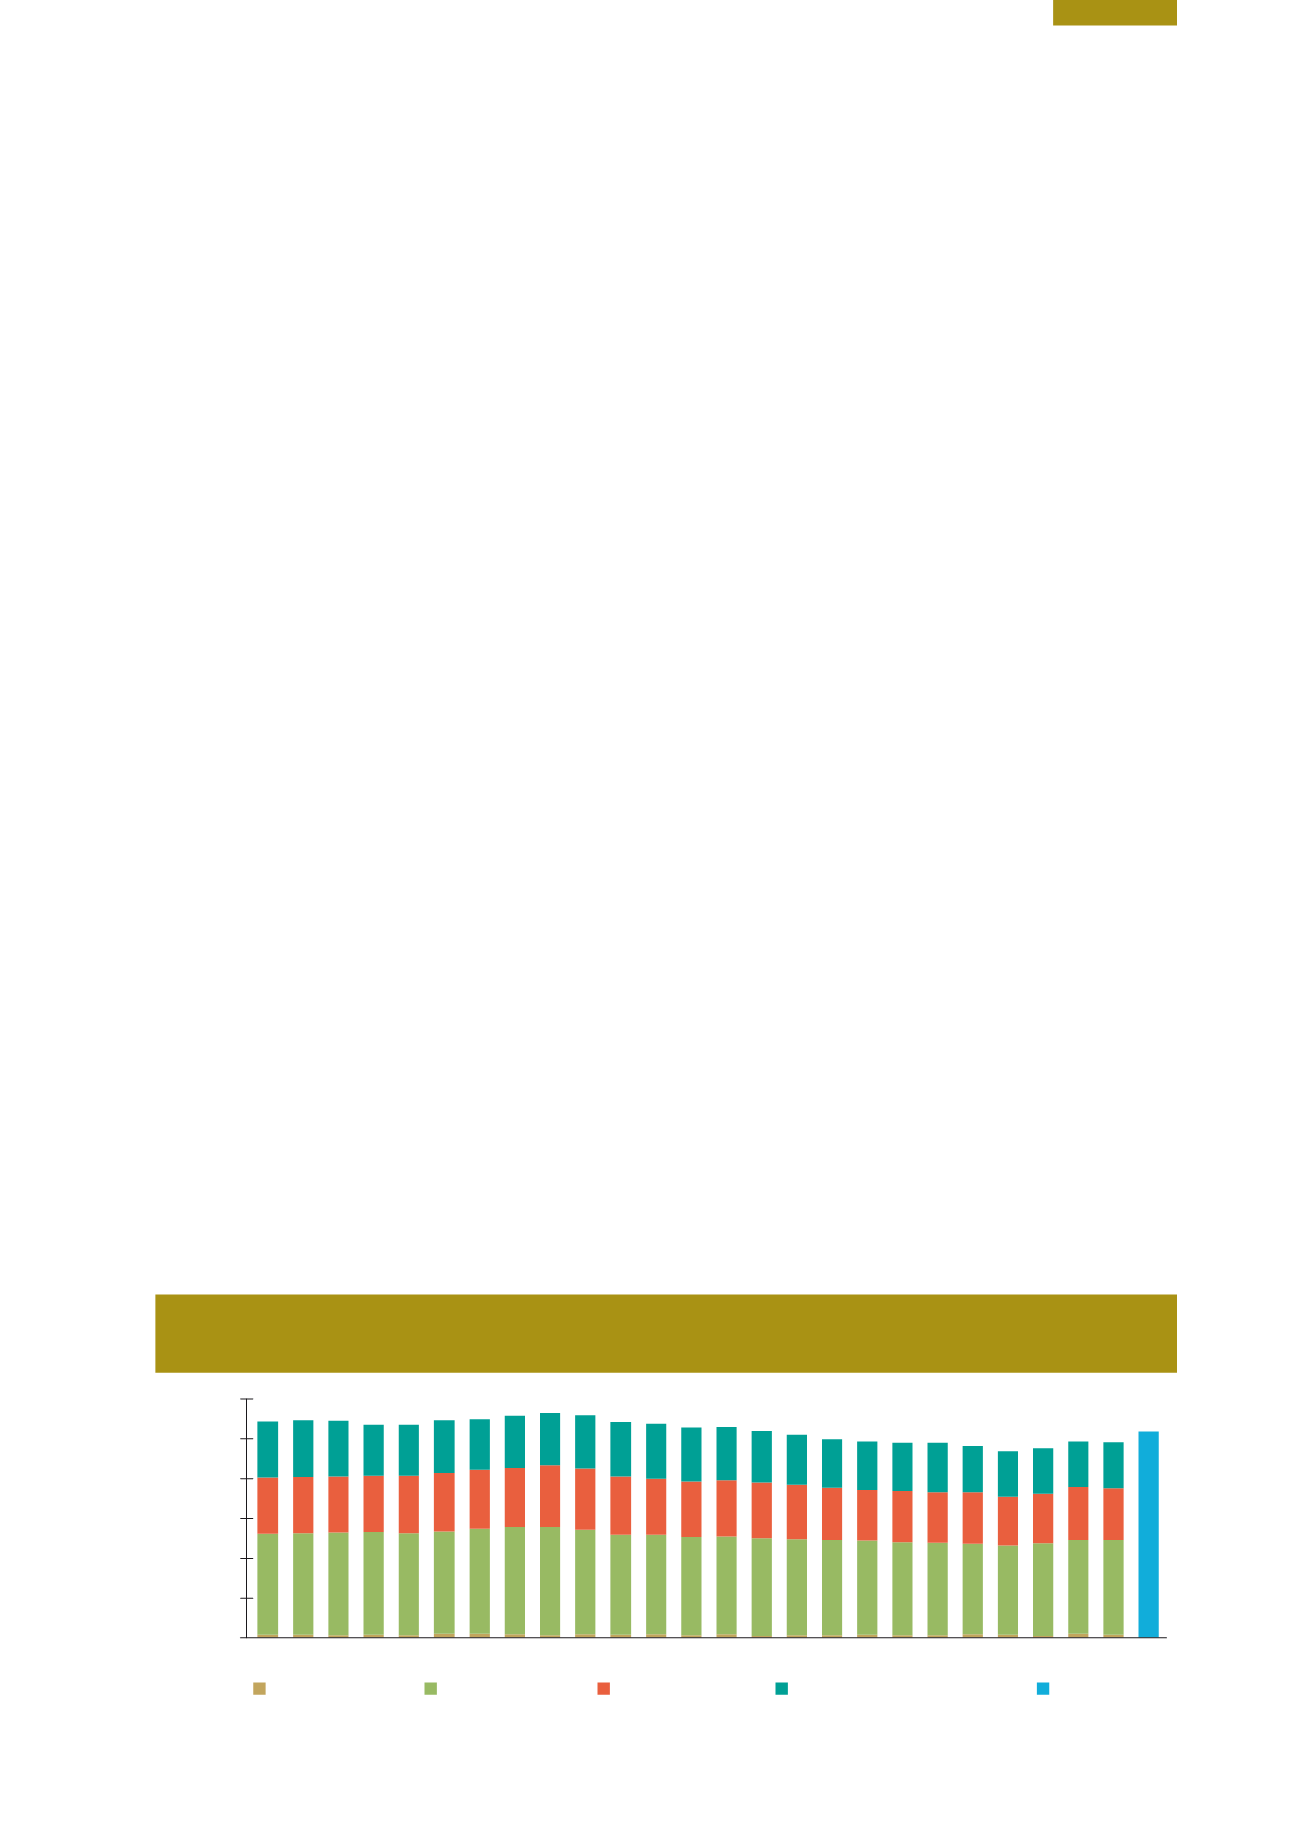
In Ireland, agriculture accounts for 32% of all
greenhouse gas emissions to air.
Climate change is challenging for Irish agriculture both in
the context of GHG emissions and the need for adaptation
of farming practices to be more resilient to the impacts
of climate change. In Ireland the Agriculture sector was
directly responsible for 32.2% of national GHG emissions
in 2014, mainly methane from livestock, and nitrous
oxide due to the use of nitrogen fertiliser and manure
management (EPA, 2016a). These direct emissions are
accountable under the Effort Sharing Decision and are
included in Ireland’s targets for 2020 emissions reduction.
In addition, agricultural land management practices can
lead to both emissions and removals of GHGs associated
both with biomass and soils which are reported under
the Land Use and Land Use Sector (Chapter 3). Based on
best available data, net impact of land management is
dominated by a very significant emission of carbon dioxide
due to drainage of organic soils. Although the total area
involved is relatively small, at approximately 300,000 ha,
the impact is large.
Agriculture accounted for over 47% of all Non-ETS
emissions in 2014 (EPA, 2016b). Despite ongoing improved
efficiency of production, leading to lower emissions per unit
product, EPA projections estimate increasing agricultural
emissions associated with Food Wise 2025 and expansion of
the dairy herd. For example, projections indicate agriculture
emissions will increase by 6% from 2014 to 2020 even
where there is the optimum deployment of known
measures and technologies to reduce emissions. The recent
bulletin on Greenhouse Gas Emissions Projections to 2020
noted that the challenges associated with implementing
these measures should not be underestimated. Increasing
agricultural emissions at a time when Ireland is struggling to
meet 2020 and 2030 emissions reduction targets may place
a burden on the wider economy.
Figure 12.4
Greenhouse Gas Emissions from Agriculture and Associated Land Between 1990 and 2014 and
Projection for 2020 (Source: EPA, 2016b)
0
5,000
10,000
15,000
20,000
25,000
30,000
1990 1991 1992 1993 1994 1995 1996 1997 1998 1999 2000 2001 2002 2003 2004 2005 2006 2007 2008 2009 2010 2011 2012 2013 2014 2020
Emissions (kt Co
2
eq)
Projection 2020
Ag Co
2
Ag CH
4
Ag N
2
O
LULUCF Ag land CO
2