


 153 / 234

149
Chapter 9: Environment and the Economy
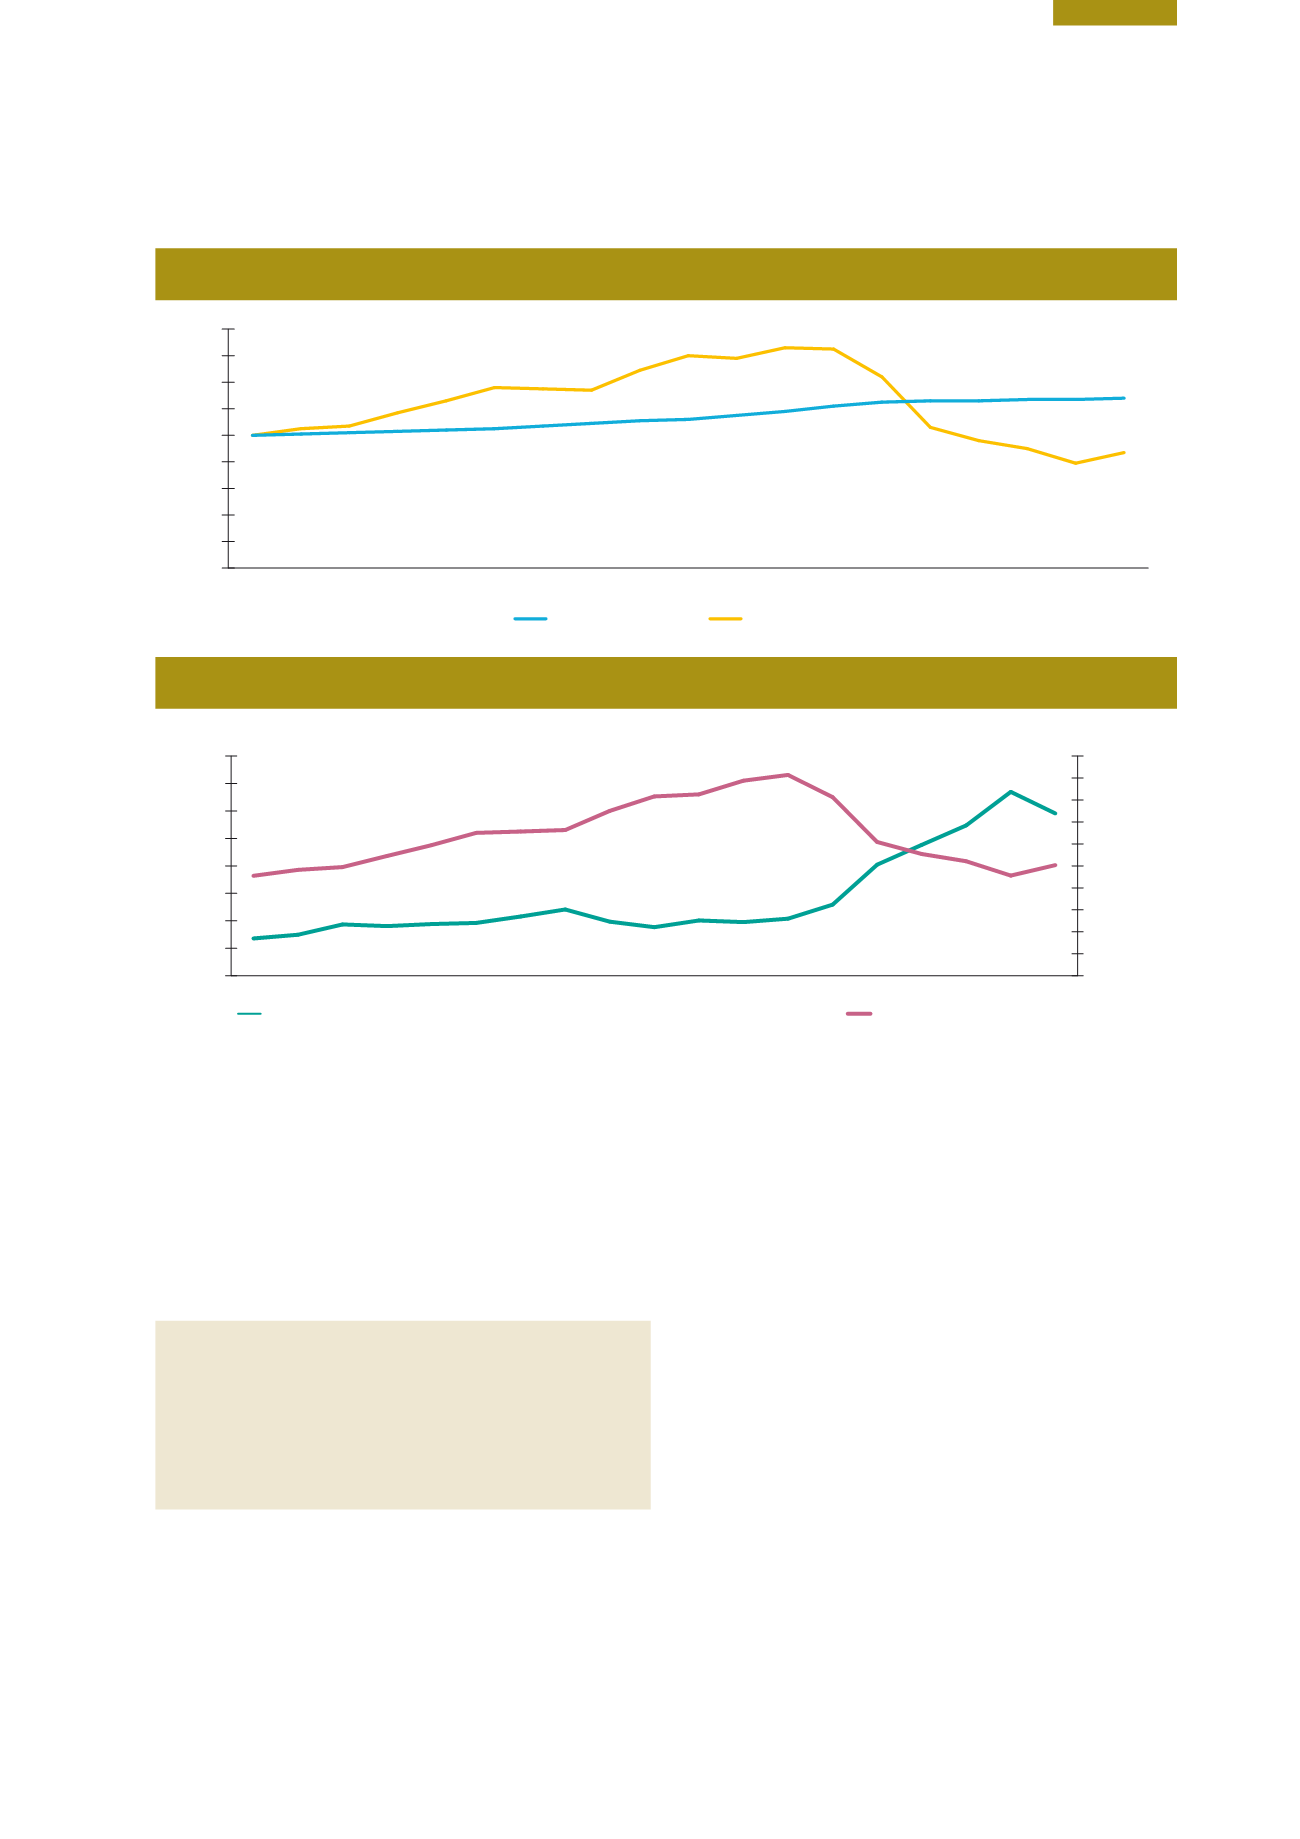
In addition, in relation to the productivity of resources
consumed as measured by gross domestic product (GDP)
(Figure 9.3) Ireland has significantly improved its financial
return (in terms of GDP) per tonne of resources consumed.
This is a crude measure of the economic efficiency of resources
consumed and masks significant sectoral variation. The main
challenge over the longer term is to ensure that the productivity
curve grows at a rate in excess of the DMC curve (decoupling).
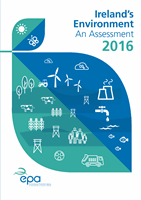
Domestic material consumption
(
DMC)
measures
the total amount of materials directly used by an
economy and is defined as the annual quantity of raw
materials extracted from the domestic territory, plus all
physical imports minus all physical exports.
(Source: EuroStat).
International and National
Policy Context
Living Well, Within the Limits of our Planet
EU action programme that sets out the long-term
vision on the environment.
Successive EU Environmental Action Programmes (EAPs)
have, since 1973, been the foundation stones of all
EU environmental policy development and are used
specifically to foster policy action and integration for
identified environmental and sustainability issues. EU
policies for the green economy, resource efficiency,
circular economy, industrial and product regulation
etc., can, in some way, trace their lineage to the Action
Programmes. In its 7th EAP,
Living Well, Within the Limits
of our Planet,
the EU has renewed its commitment to
stimulate the transition to a green economy and to strive
towards an absolute decoupling of economic growth
and environmental degradation. This, it states, will
“ease pressure on the environment and bring increased
competitiveness and new sources of growth and jobs
through cost savings from improved efficiency, the
Figure 9.2
Ireland: Resource Efficiency (Source: CSO)
0
20
40
60
80
100
120
140
160
180
2013
2012
2011
2010
2009
2008
2007
2006
2005
2004
2003
2002
2001
2000
1999
1998
1997
1996
1995
DMC per Capita
Population (000)
Index 1995=100
Figure 9.3
Ireland: Resource Productivity (Source: CSO)
600
800
1,000
1,200
1,400
1,600
1,800
2,000
2,200
2013
2012
2011
2010
2009
2008
2007
2006
2005
2004
2003
2002
2001
2000
1999
1998
1997
1996
1995
€m per 000 tonnes
Resource Productivity (€/tDMC)
0
20,000
40,000
60,000
80,000
100,000
120,000
140,000
160,000
180,000
200,000
000 tonnes
Domestic Material Consumption (000)