Basic HTML Version


Ireland’s Environment 2012
22
Introduction
Increased atmospheric concentrations
of greenhouse gases such as carbon
dioxide (CO
2
), methane (CH
4
) and
nitrous oxide (N
2
O), released by
human activities, trap additional
energy in the Earth’s climate system.
This is known as ‘global warming’
and gives rise to a range of Earth
system changes, broadly referred
to as climate change. The resultant
impacts include increasing global
average temperature, loss of snow
and ice cover, and global sea-level
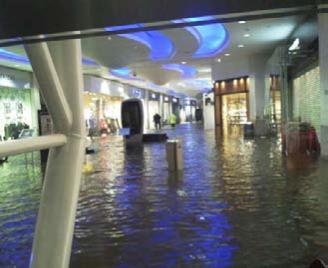
rise. If not addressed, the projected
impacts of climate change present
a very serious risk of dangerous
global impacts. These would threaten
global food production and natural
ecosystems, and could cause
irreversible flooding of low-lying
coastal areas.
The causes and consequences of
climate change pose an immense
global challenge which is addressed
at an international level under the
UN Framework Convention on
Climate Change (UNFCCC) and the
Kyoto Protocol. At an EU level the
Climate and Energy Package
and the
forthcoming
Adaptation Strategy
provide the context for actions in
Ireland. However, Ireland must deal
with its own unique conditions and
circumstances that arise from its
location, geography and economy,
which provide a unique greenhouse
gas emissions profile within the EU.
The Current Situation
Enhanced atmospheric concentrations
of a range of long-life greenhouse
gases (GHG) trap energy in the
Earth’s climate system. Figure 2.1
shows the increasing concentration
of CO
2
, the most important
greenhouse gas, measured at Mace
Head, Co. Galway, since 1991.
Similar observations are found
at other sites around the world.
Such direct observations are
complemented by ice-core
measurements which show that
current atmospheric GHG levels
far exceed the natural range that
has existed for over 650,000 years
(IPCC, 2007).
The effects of enhanced GHG levels
are most evident in the long-term
global temperature record. Most
recent studies show that the average
ambient temperature in Ireland
increased by 0.7°C over the period
1890–2007. There is also evidence
of a trend towards more intense and
more frequent rainfall. These trends
are reflected in ecosystem changes,
with changes in, or lengthening of,
the growing season and increasing
Figure 2.1
Atmospheric Carbon Dioxide Levels at Mace Head (Source: EPA/CNRS)
340
345
350
355
360
365
370
375
380
385
390
395
1990
1992
1994
1996
1998
2000
2002
2004
2006
2008
2010
Concentration (ppm)
Conc (ppm)
Linear (Conc (ppm))